| Prev | ICM User's Guide 7.4 Chemical FingerPrint QSAR Model Tutorial | Next |
| Documentation |
In this example we build a 2D QSAR FingerPrint model based on pKd data for a selection of inhibitors to a nuclear hormone receptor Thyroid Hormone Receptor Alpha using 2D Chemical FingerPrints.
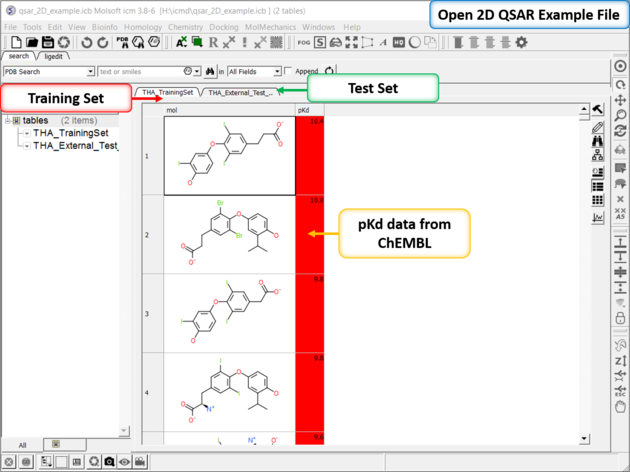 |
| Step 1: Download and open the prepared ICM file. The file can be downloaded here ftp://ftp.molsoft.com/pub/workshop/ (1. cut and paste the address into a web browser. 2. Right click on qsar_2D_example.icb and choose "Save Link As". 3. Open the .icb in ICM File/Open). Notice the file contains two tables: we will use THA_TrainingSet to build the QSAR model and THA_External_Test_Set to test the model. Each table contains experimental pKd from ChEMBL. |
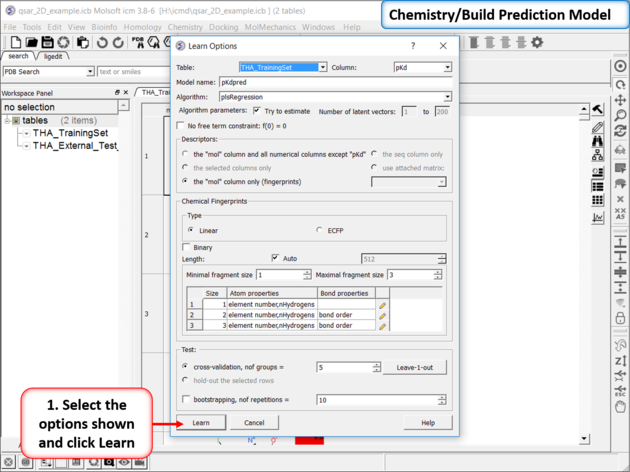 |
| Step 2: Build the model using the options in Chemistry/Build Prediction Model. Use the options shown in the picture above - each option is described in more details here. In this example we will use the PLS regression algorithm to build the model. |
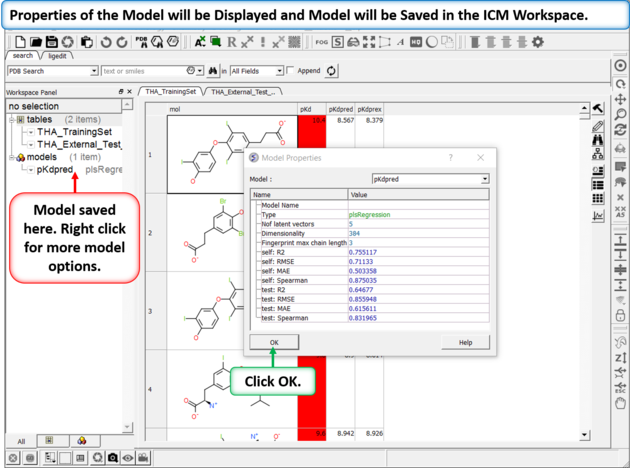 |
| Step 3: Once the model is built a table displaying the model properties will be displayed. The self and test R2 values are shown giving an indication of the quality of the model. The model is saved in the ICM workspace - right clicking on the model in the ICM workspace allows you to view the model data. |
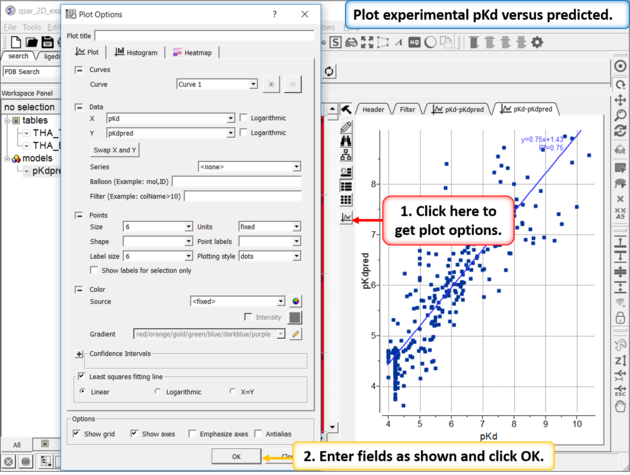 |
| Step 4: One way to visualize the quality of the model is to plot the ecperimental pKd (pKd) versus the predicted pKd (pKdpred). There are other options in the right click menu to improve the model or look at the`model-weight{weights}. |
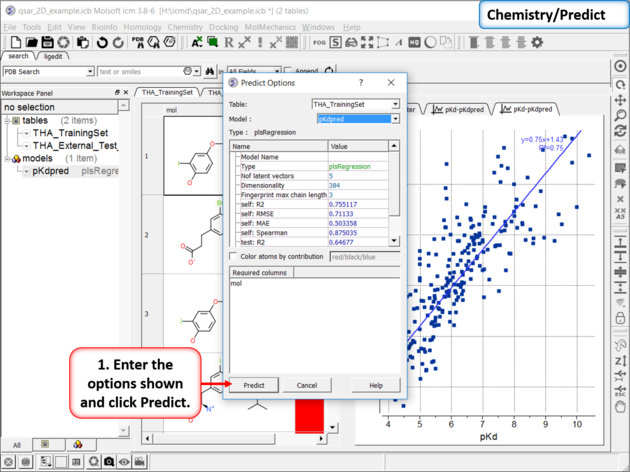 |
| Step 5: When you are happy with your model you can use it to predict pKd for the external test set in the THA_External_Test_Set table. Use the options in Chemistry/Predict. |
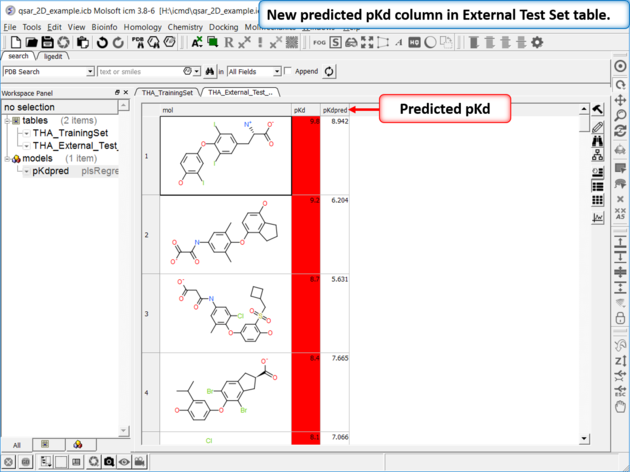 |
| Step 6: A new column containing the predicted pKd will be displayed. |
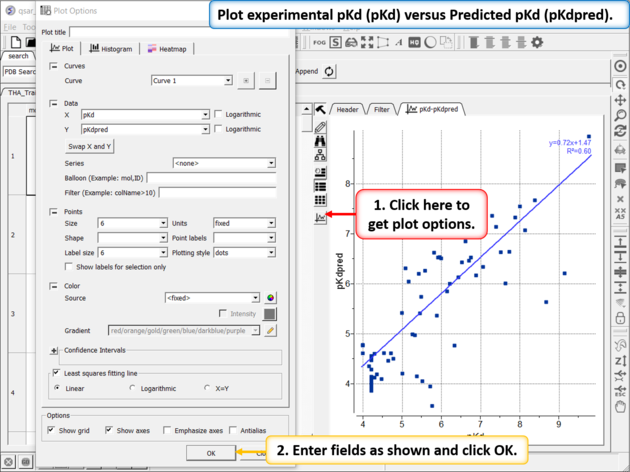 |
| Step 7: Plot experimental pKd (pKd) versus Predicted pKd (pKdpred)to visualize the data and observe reported R2 value.
|
| Prev Biomolecule | Home Up | Next 3D QSAR Tutorial |