Google Search: Keyword Search:
| Prev | ICM User's Guide 11.4 Cheminformatics Tutorials | Next |
[ Draw and Spreadsheet | Tutorial - Chemical Searching | Tutorial - Chemical Clustering | Large Chemical Space | 3D Pharmacophore Searching | 2D Pharmacophore Searching | Create Markush | Enumerate Markush | Decompose Markush | Reaction | Activity Cliffs ]
11.4.1 Chemical Draw and Spreadsheet Tutorial |
Background
Cycloxygenase 2 (COX-2) inhibitors can target inflammation and pain and are non-steroidal anti-inflammatory (NSAID) drugs. Some of the COX-2 inhibitor drugs have an interesting history because some of them cause a significant increase in heart attacks and stroke in patients. Probably the best known COX-2 inhibitor is Merck's drug Vioxx which was voluntarily removed from the market in 2004. In this example we are going to build a small database of COX-2 inhibitor drugs, learn how to import C0X-2 inhibitor data from ChEMBL and how to manipulate chemical spreadsheets in ICM.
Tutorial
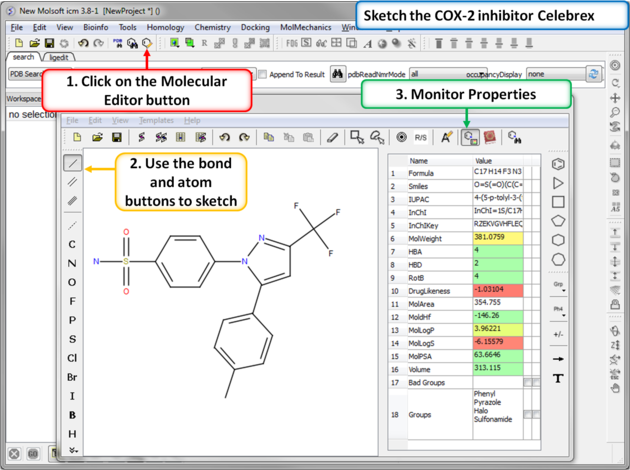 |
| Step 1: Sketch Celebrex. The first COX-2 drug we are going to draw is Celebrex (Celecoxib) from Pfizer. Click on the Molecular Editor button and use the bond and atoms button to skethc Celebra (shown). Note you can monitor key chemical properties of the molecule as you sketch it. |
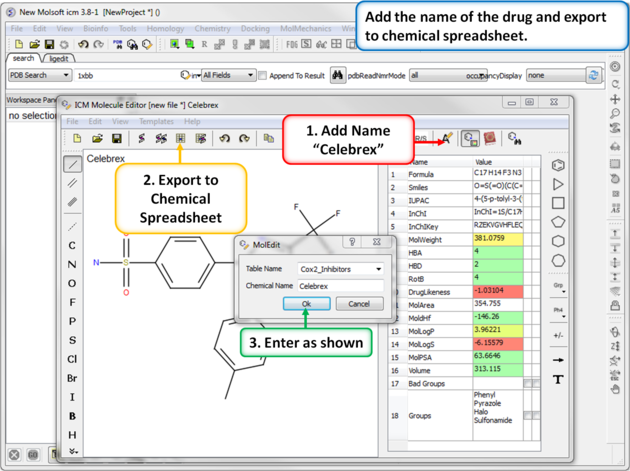 |
| Step 2: Export to Chemical Spreadsheet. Rename the chemical to its brand name (Celebrex) and export to a chemical spreadsheet. |
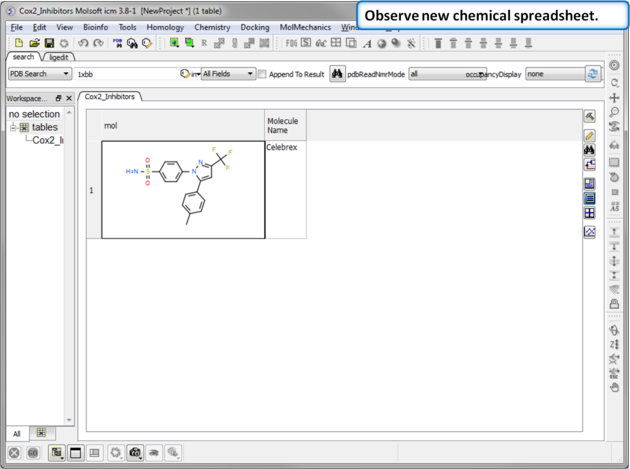 |
| Step 3: Observe Chemical Spreadsheet. You should now have one chemical in your Cox2_Inhibitors spreadsheet. |
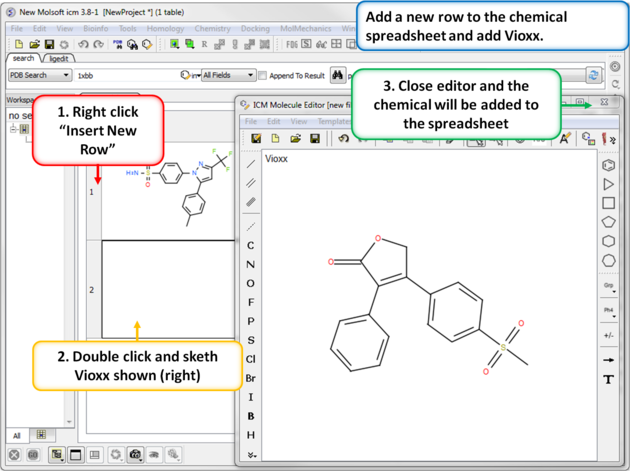 |
| Step 4: Add a new row. Add a new row to the spreadsheet and then sketch the Vioxx (Rofecoxib) drug (shown). |
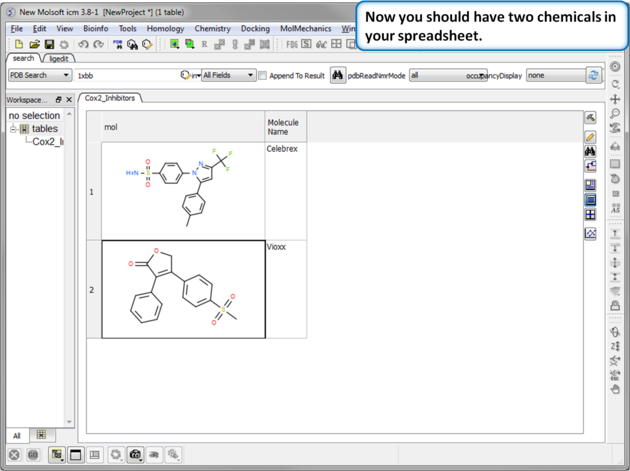 |
| Step 5:Observe Chemical Spreadsheet. Now you should have 2 chemicals in your spreadsheet. |
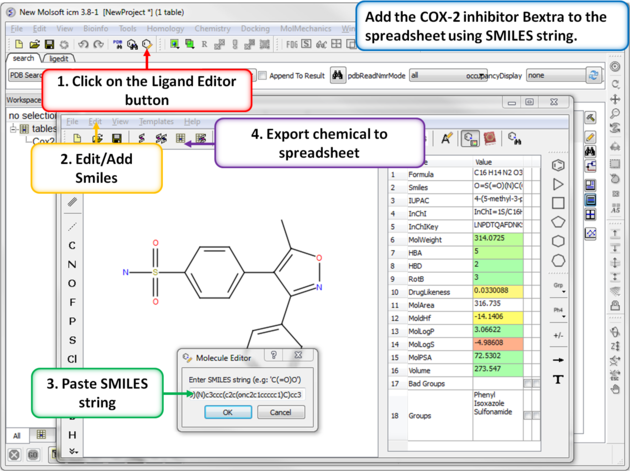 |
| Step 6: Using SMILES. A convenient way to import chemical data is by using SMILES. Bextra (Valdecoxib) is a COX-2 inhibitor that was removed from the market by Pfizer in 2005 due to concerns ofan increased risk of heart attack and stroke. Bextra's SMILES string is: O=S(=O)(N)c3ccc(c2c(onc2c1ccccc1)C)cc3 |
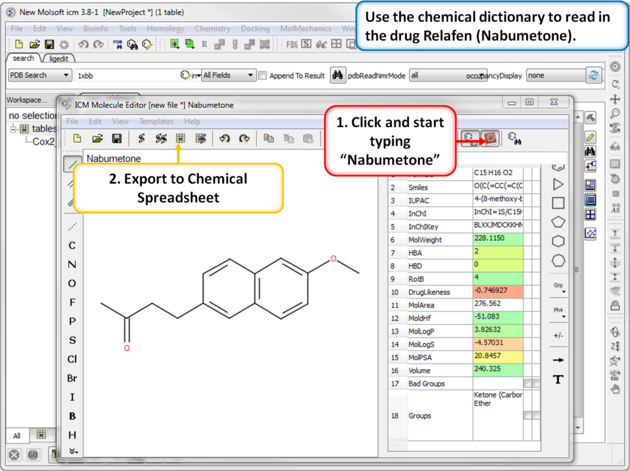 |
| Step 7: Using the Chemical Dictionary. Another convenient way to import chemical data is to use the in built chemical dictionary. Relafen is Nabumetone is an NSAID that is rapidly metabolized in the liver to a major active metabolite, 6-methoxy-2-naphthyl acetic acid. |
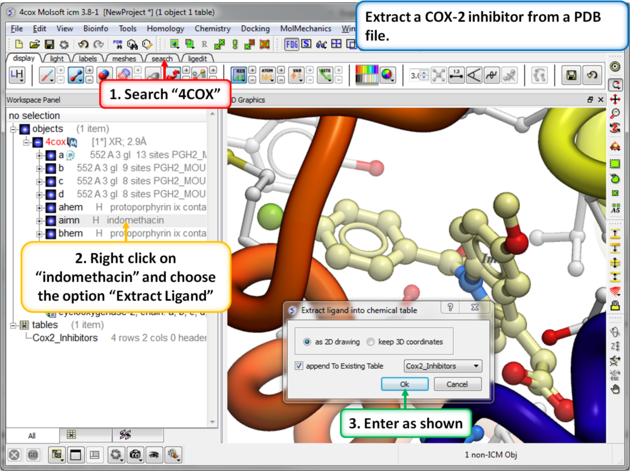 |
| Step 8: Extracting Chemicals from the PDB. You can extract a chemical from a PDB file into a chemical spreadsheet by right clicking on the ligand in the ICM workspace and choosing the option "Extract Ligand". |
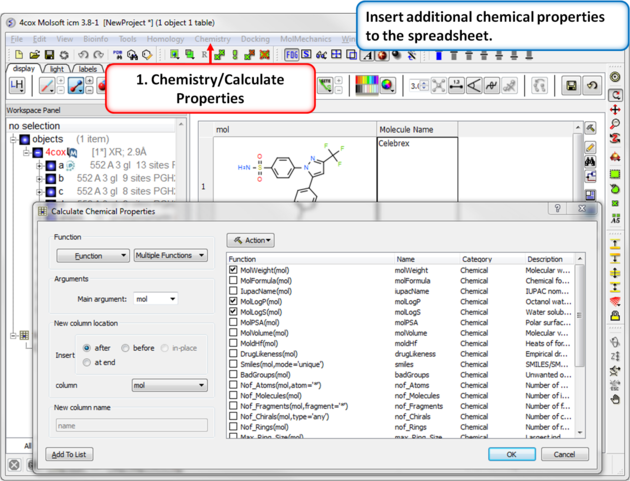 |
| Step 9: Calulate Properties and Insert Columns. Use the Chemistry/Calculate Properties to calculate properties (e.g. logP, logS, MW) for the drugs in the spreadsheet. |
In this example we will import more COX-2 inhibitor information from ChEMBL. ChEMBL is a database of bioactive drug-like small molecules curated from the primary scientific literature.
| Note: In version 3.8-4 and higher you can search ChEMBL directly from the GUI interface. |
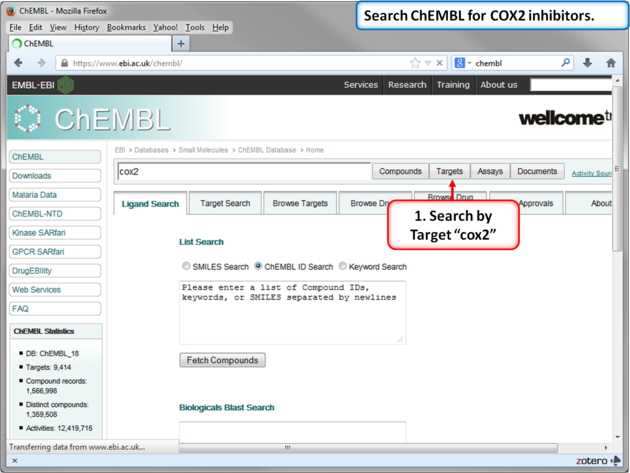 |
| Step 10: Search for COX-2 in ChEMBL. |
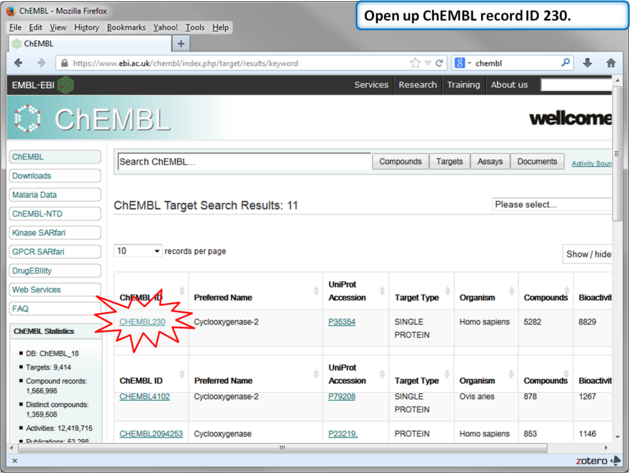 |
| Step 11: Select Human COX-2 entry. |
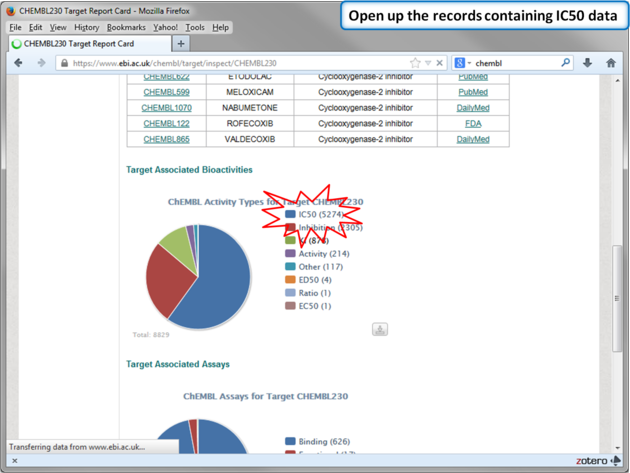 |
| Step 12: Select chemicals annotated with Ki values. |
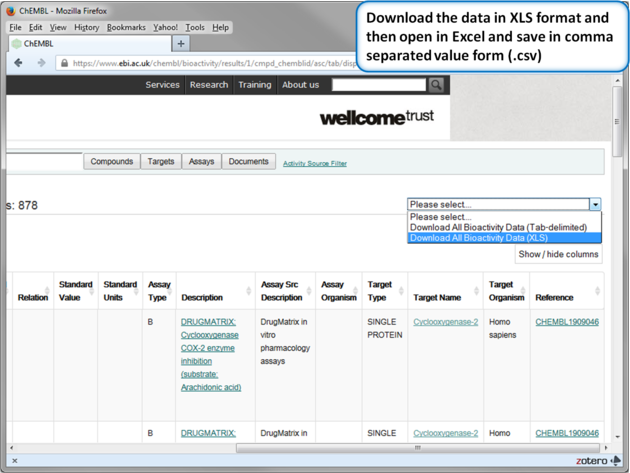 |
| Step 13: Download in XLS format. |
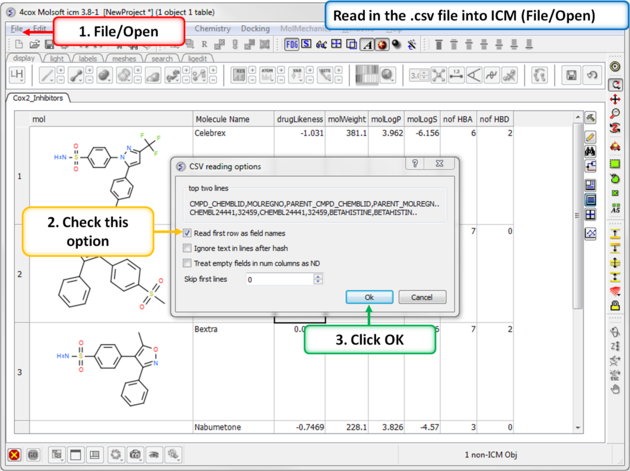 |
| Step 14: Convert to csv format. Open the .xls file in Excel and save in comma separated value format (.csv). Read in the .csv file into ICM using File/Open. Rename the table Cox2_Inhibitors - right click on table header tab and choose rename. |
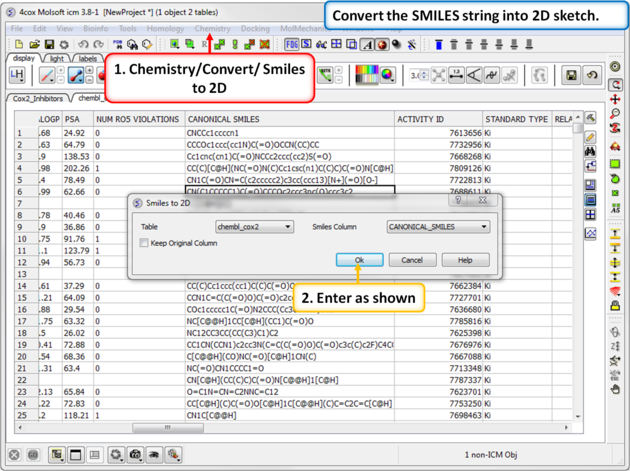 |
| Step 15: SMILES to 2D. Convert the SMILES column into 2D. This may take a little bit of time because the table is quite large. We can use this table in the following tutorial. |
11.4.2 Chemical Searching |
Background
This tutorial follows on from the previous tutorial where we made a database of COX-2 inhibtors (Cox2_Inhibitors) and read in a chemical spreadsheet containing IC50 data from ChEMBL (chembl_cox2). In this tutorial we will perform chemical spreadsheet comparison and explore some of the chemical search options inside ICM.
Tutorial
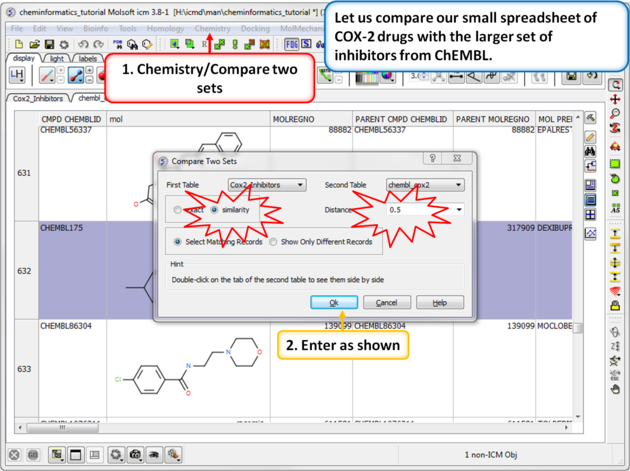 |
| Step 1: Similarity search - compare two spreadsheets. Here we can compare our two chemical spreadsheets using Chemistry/Compare two sets using a similarity search. |
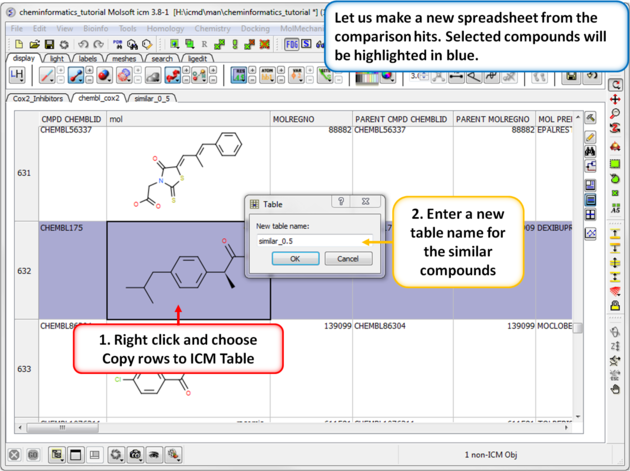 |
| Step 2: Output the similar chemicals to a new spreadsheet. Similar compounds are selected (shaded blue) we can extract them to a new table using the right click menu. |
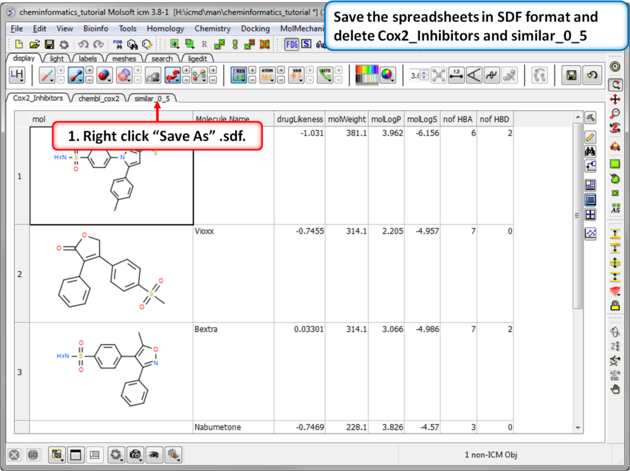 |
| Step 3:Save as SDF. You can save any chemical spreadsheet by right clicking on the table header tab. |
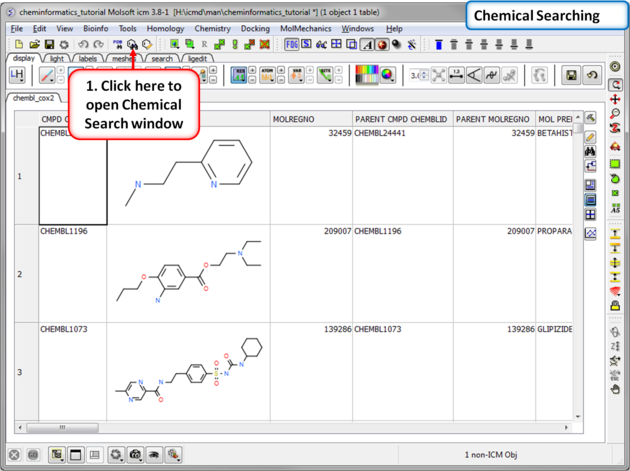 |
| Step 4:Chemical Searching. Now let us explore the chemical search options. |
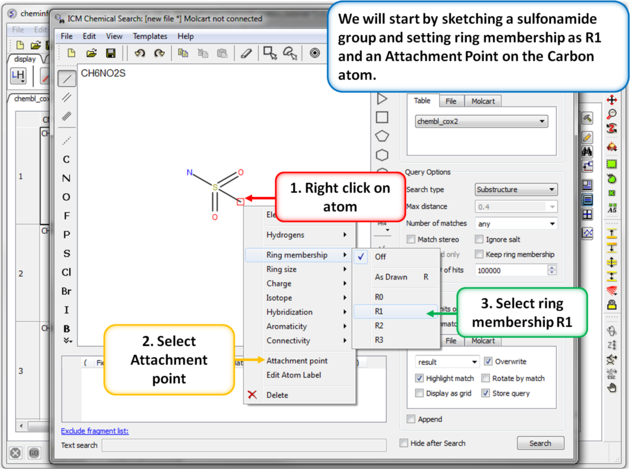 |
| Step 5: Sketch search query. We will start by sketching a sulfonamide group and setting ring membership as R1 and an Attachment Point on the Carbon atom. |
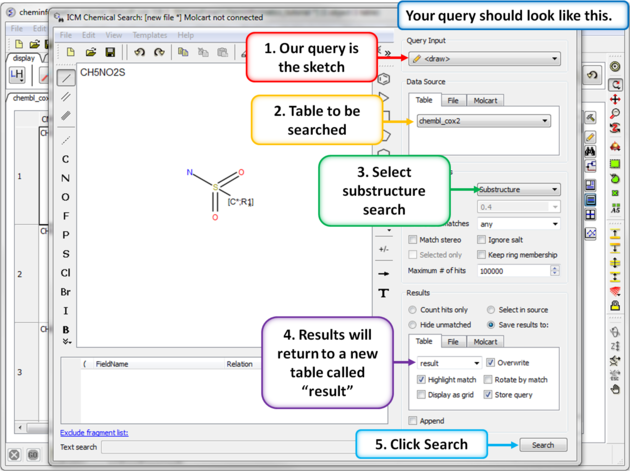 |
| Step 6: Chemical search window. Choose the options as shown in the screenshot and press search. |
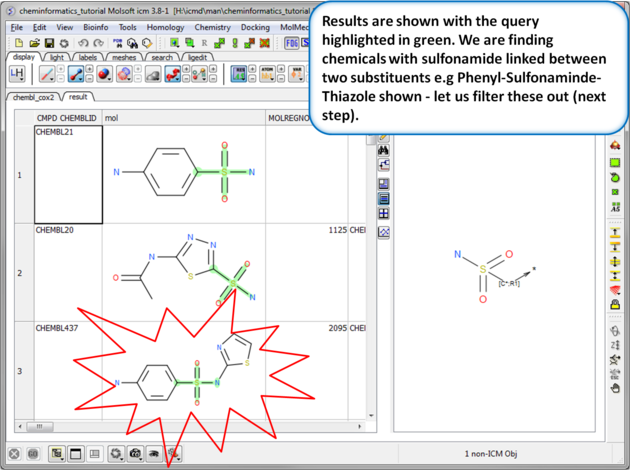 |
| Step 7: Search query results. The results will be displayed in a table as shown. |
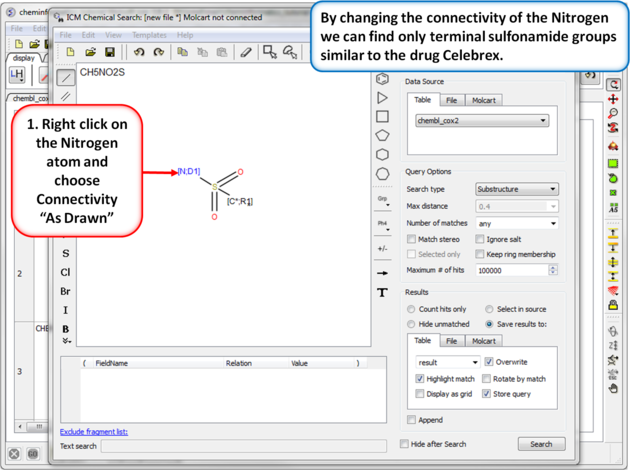 |
| Step 8: Query filter - connectivity. By changing the connectivity of the Nitrogen we can find only terminal sulfonamide groups similar to the drug Celebrex. |
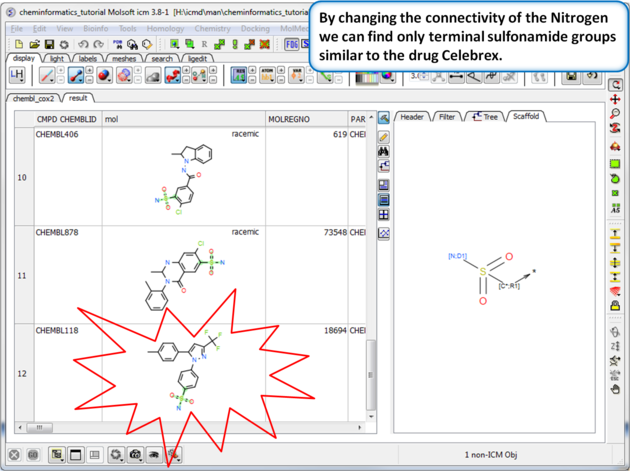 |
| Step 9:Query filter results By changing the connectivity of the Nitrogen we can find only terminal sulfonamide groups similar to the drug Celebrex. |
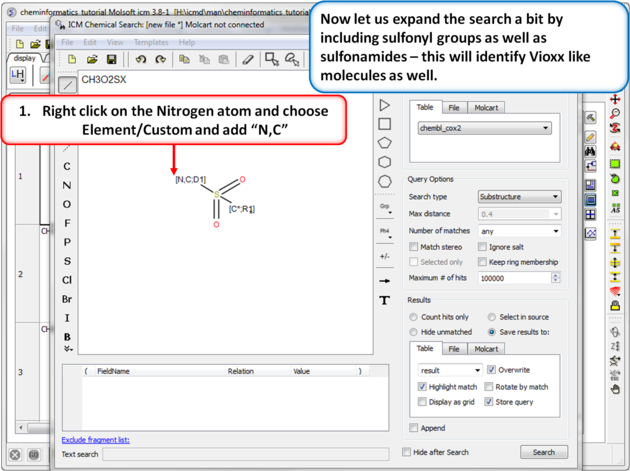 |
| Step 10:Query filter - Custom Element. Now let us expand the search a bit by including sulfonyl groups as well as sulfonamides - this will identify Vioxx like molecules as well. |
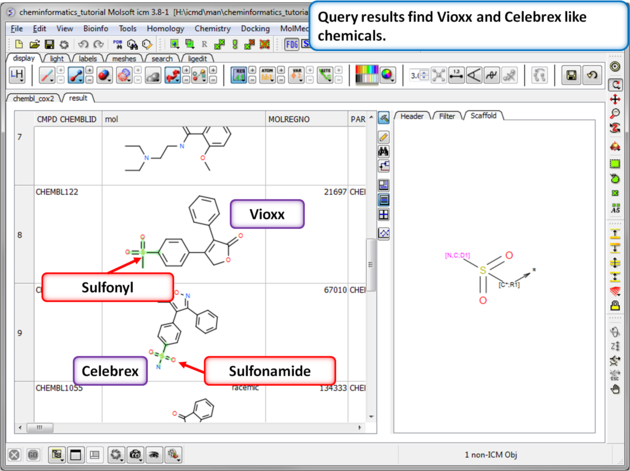 |
| Step 11: Query filter results. By adding to the filters we can identify Vioxx-like chemicals containing sulfonyls and Celebrex-like chemicals containing sulfonamide groups. |
11.4.3 Chemical Clustering |
Background
This tutorial follows on from the previous tutorial where we made a database of COX-2 inhibtors (Cox2_Inhibitors) and read in a chemical spreadsheet containing IC50 data from ChEMBL (chembl_cox2). In this tutorial we will perform chemical clustering on the ChEMBL chemical spreadsheet.
Tutorial
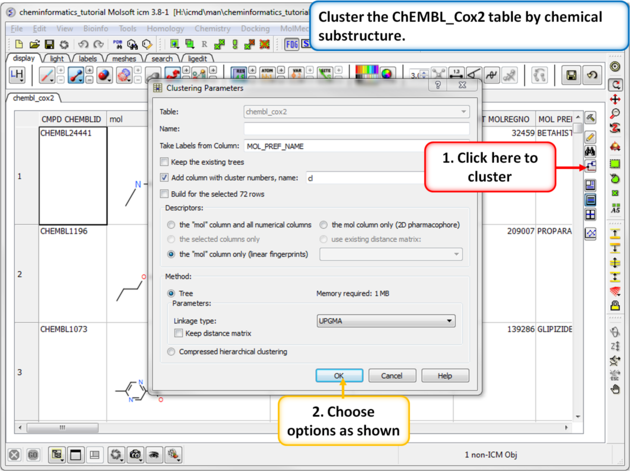 |
| Step 1: Cluster Cluster the ChEMBL_Cox2 table by chemical substructure using the options shown in the screenshot. |
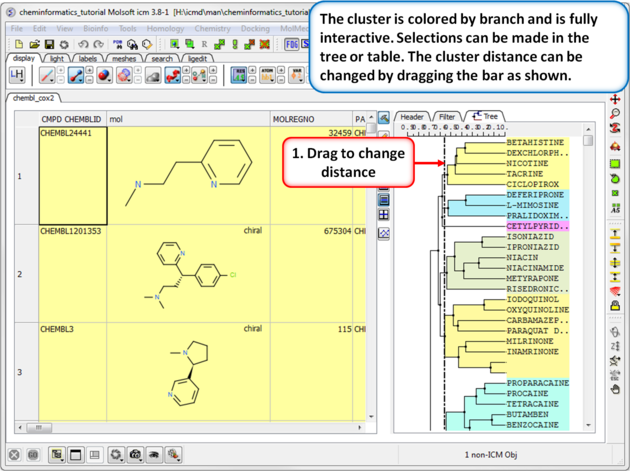 |
| Step 2: Change the distance of the tree. The cluster is colored by branch and is fully interactive. Selections can be made in the tree or table. The cluster distance can be changed by dragging the bar as shown.
|
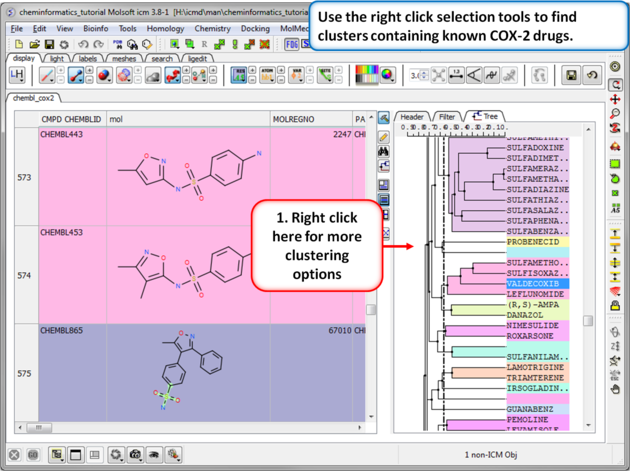 |
| Step 3: Cluster options. Use the right click selection tools to find clusters containing known COX-2 drugs. For example, right click and choose select centers, explore other options in the right click menu. |
11.4.4 Working with Large Chemical Space |
[ Build and Visualize | Select ChemSpace | Delete Rows | Append | SDF | Projection | Distinguish | Compare, Merge, Duplicates ]
11.4.4.1 Build and Visualize Chemical Space |
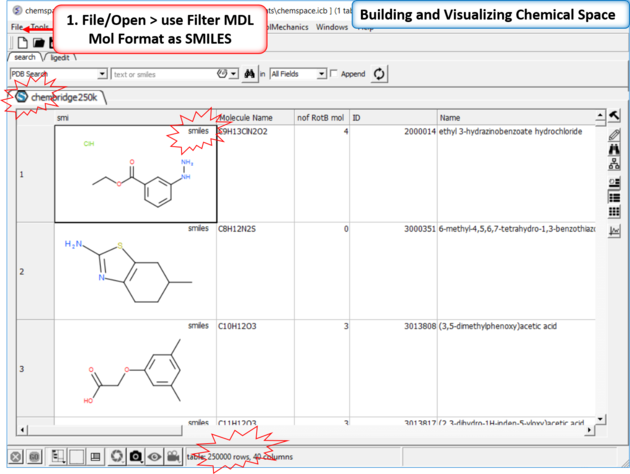 |
| Step 1: Read in a large SDF file. In this example we are reading in an SDF file containing >250K chemicals. This is too large for the memory of most desktop computers and so we read it in using the File/Open filter MDL Mol Format as SMILES. |
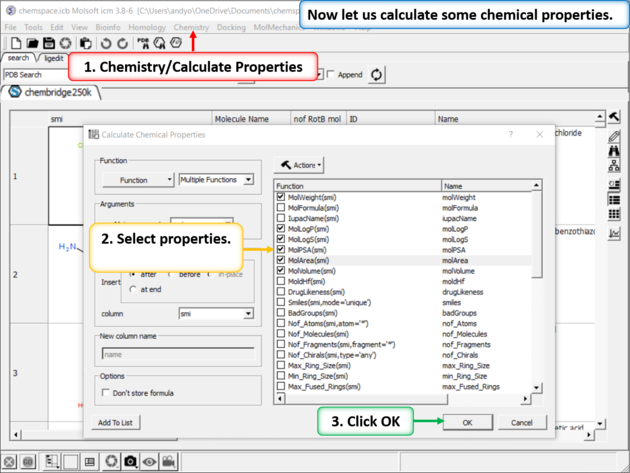 |
| Step 2: Add some chemical properties to the chemical spreadsheet. |
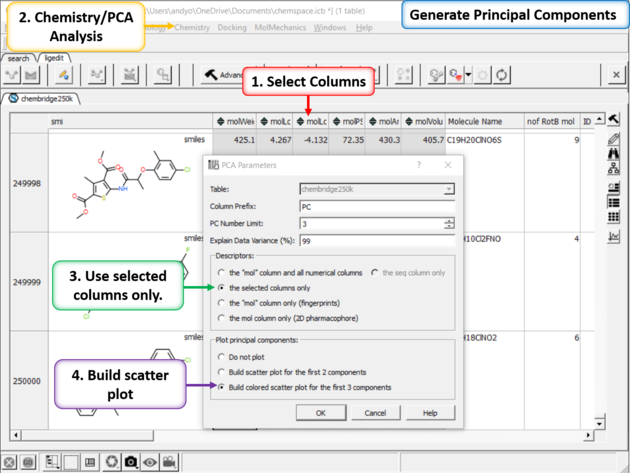 |
| Step 3: PCA Select 6 of the new properties you added to the table. Generate Principal Components using the options in Chemistry/PCA Analysis. |
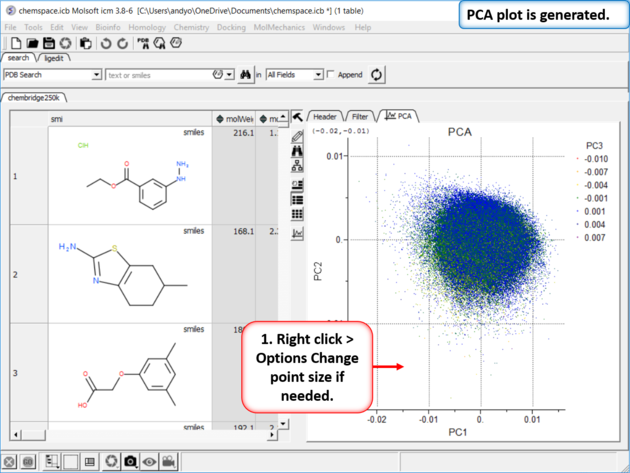 |
| Step 4:PCA Analysis Plot is Generated. Right click on the plot and choose Options to change parameters such as point size. |
11.4.4.2 Select Molecules in Chemical Space |
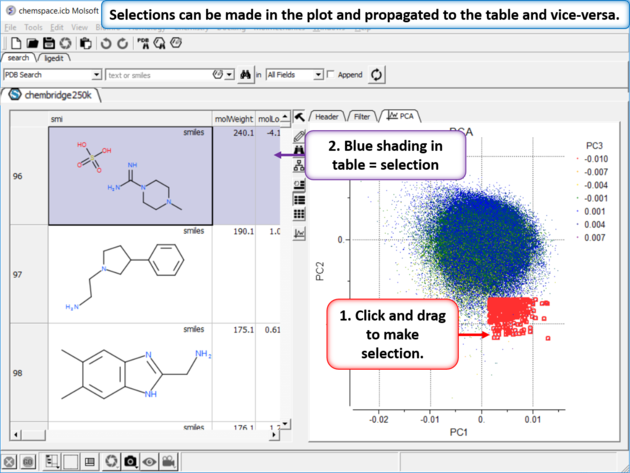 |
| Step 5: Selections. Selections can be made in the plot and propagated to the table and vice-versa. |
11.4.4.3 Delete Row |
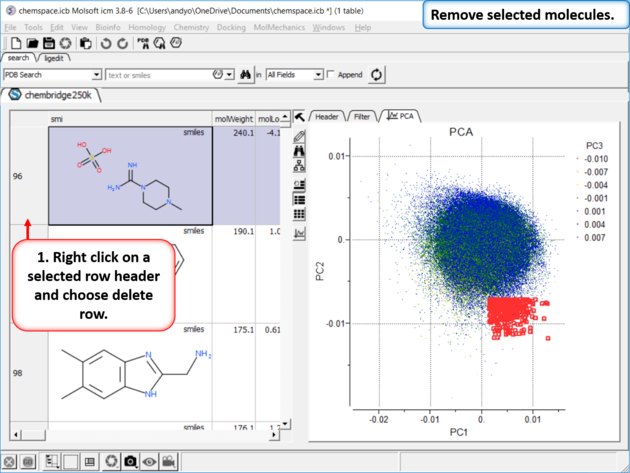 |
| Step 6: Delete Rows |
11.4.4.4 Append to New Workspace (Spreadsheet) |
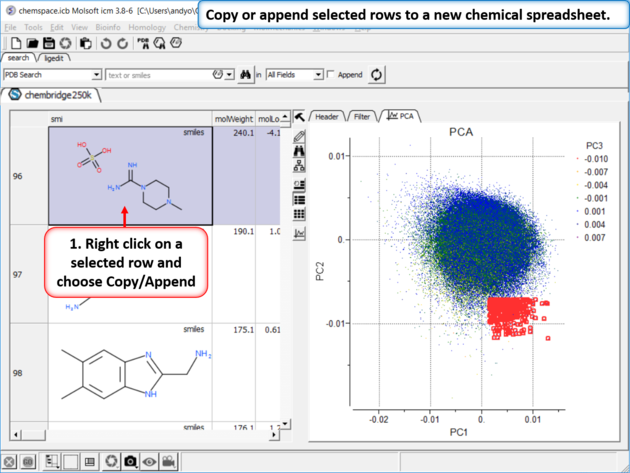 |
| Step 7: Copy or append selected rows to a new chemical spreadsheet. |
11.4.4.5 Export Chemical Space to SDF File Format |
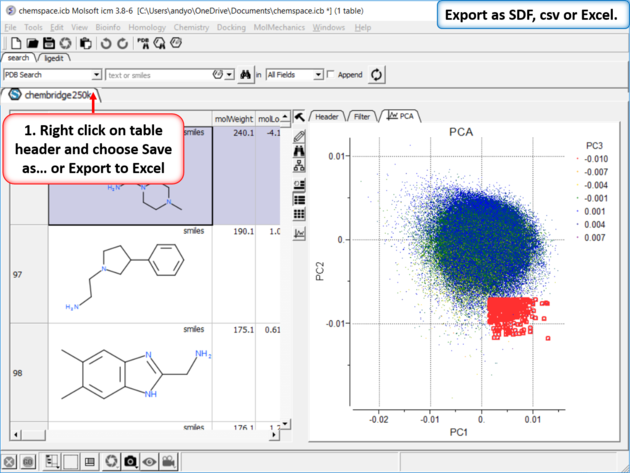 |
| Step 8: Export as SDF, csv or Excel. |
11.4.4.6 Project New Molecules in the Chemical Space |
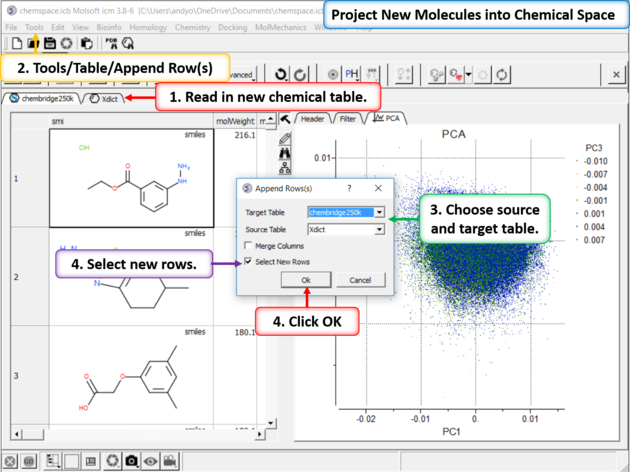 |
| Step 9:Project New Molecules into Chemical Space Use Tools/Table/Append Row(s). |
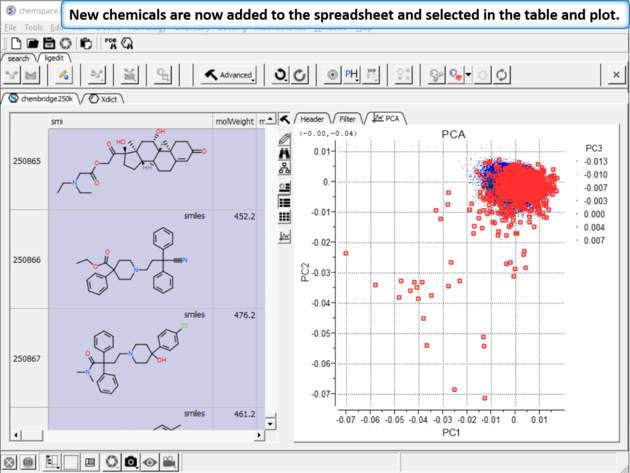 |
| Step 10:New chemicals are now added to the spreadsheet and selected in the table and plot. |
11.4.4.7 Distinguish between different sets of molecules in Chemical Space |
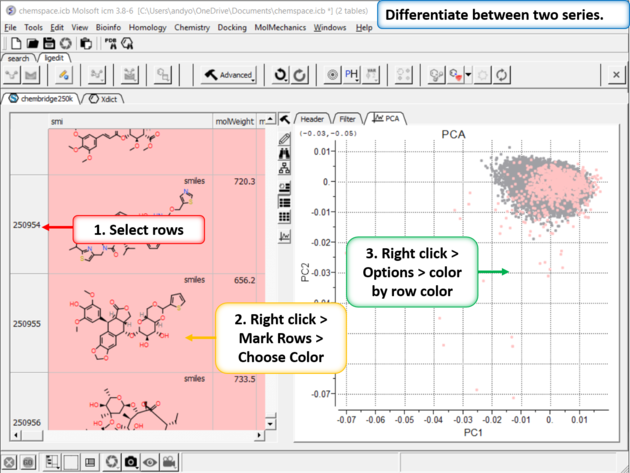 |
| Step 11:Differentiate between two series. You can differentiate between two series by coloring rows and then propagating that row color to the plot. |
11.4.4.8 Compare, Merge and Select Duplicates in Chemical Space |
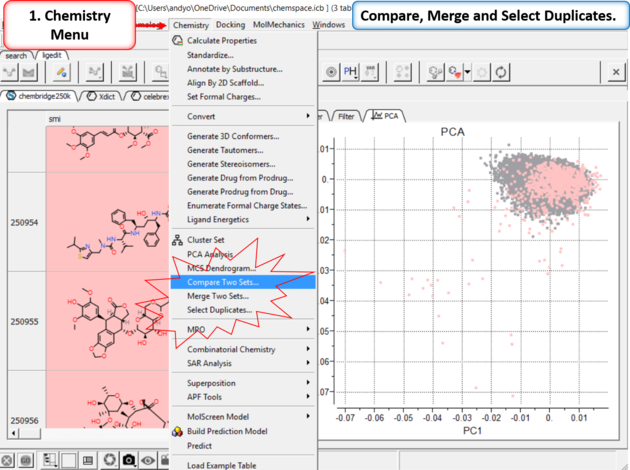 |
| Step 12: Compare, Merge and Select Duplicates. |
11.4.5 3D Pharmacophore Searching |
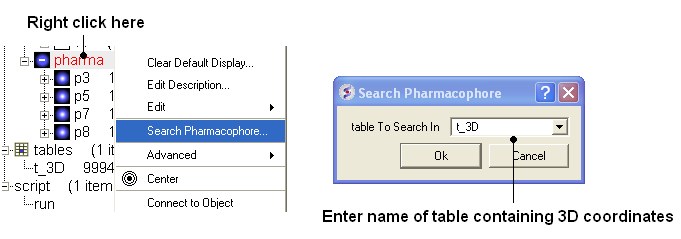
Objective Undertake a 3D pharmacophore search of a table containing 3D coordinates.
- File/Open example_ph4.icb (this file is provided in the ICM distribution and therefore can be found in $ICMHOME or in Windows Program Files/MolSoft
- In this example the 3D pharmacophore has already been extracted from a ligand. To find out how to generate a 3D pharmacophore see the section entitled Pharmacophore Draw 3D.
- In this example a table containing 3D coordinates is already provided containing 3D coordinates. The table is called t_3D.
- To run 3D pharmacophore searching right click on the name of the pharmacophore object in the ICM Workspace and select Search Pharmacophore.
- Select the table t_3D from the drop down list and click OK.
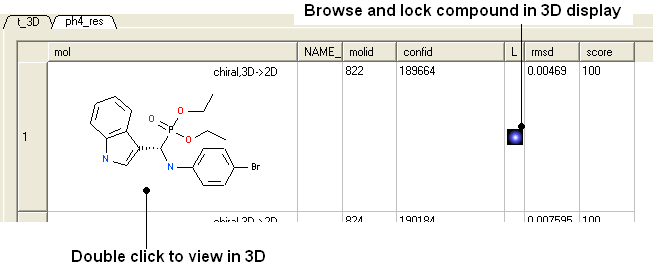
- A table of search results will be displayed.
- You can browse the results by clicking on the table and the ligand will be displayed in the graphical display.
- Remember you can use the check boxes in column L to lock compounds and overlay them.
Manual References (Web Links)
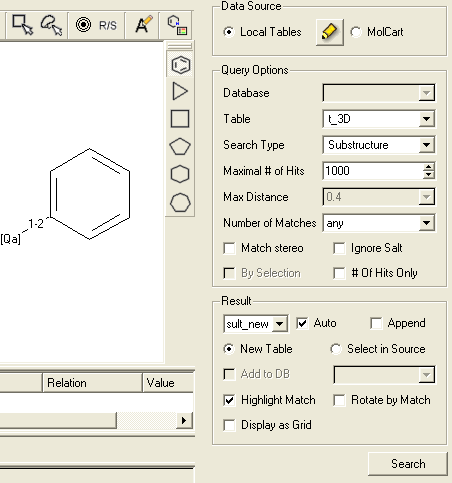
11.4.6 2D Pharmacophore Searching |
Objective Undertake a 2D pharmacophore search of a chemical spreadsheet.
- File/Open Examples example_ph4.icb
- Click on the Chemical Search button.
- Draw the query as shown below using the tools in the chemical search window.
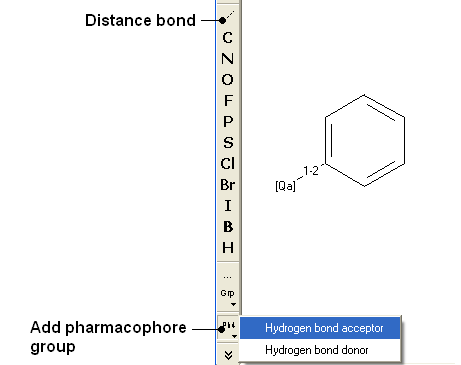
- Fill in the query and results option as shown below.
- Click the Search button and a table of the hits that match the query will be displayed.
Manual References (Web Links)
11.4.7 How to create a Markush structure. |
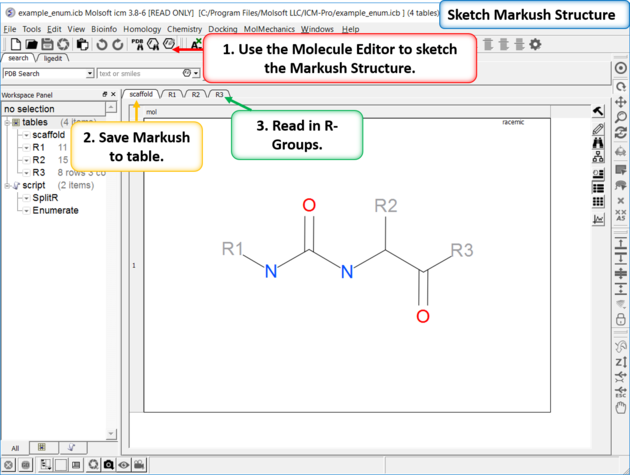 |
| Setup A pre-prepared example is available in File/Open Examples > example_enum.icb. The markush structure has already been drawn and the R-groups have been read into ICM. The Markush structure is ready to be created. |
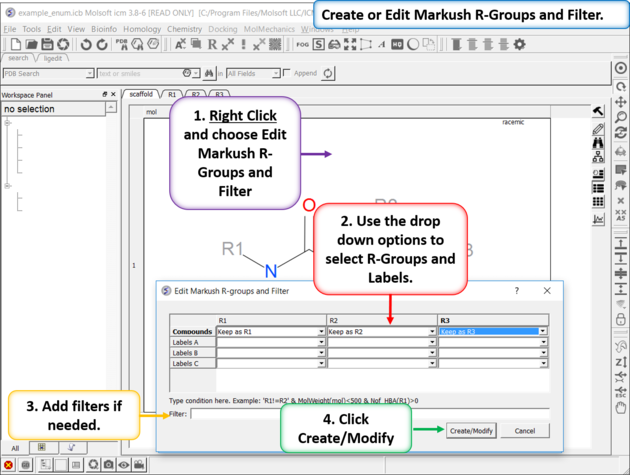 |
| Create or Edit Markush R-Groups and Filter. Right Click and choose Edit Markush R-Groups and Filter. Add the R-groups, labels and filters and then click on Create/Modify. |
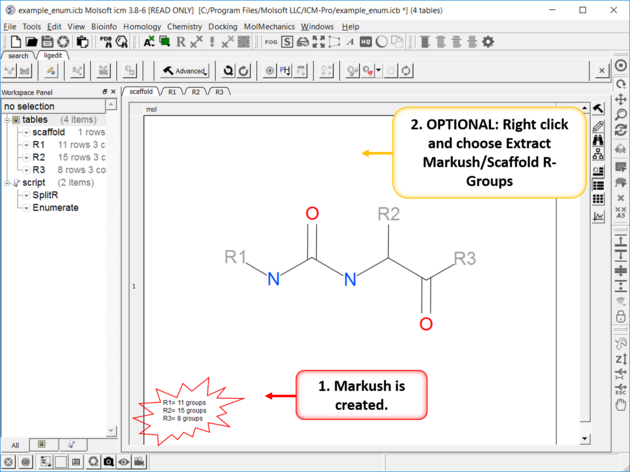 |
| The Markush Structure is Created. If you want to see the R-Groups in a separate table you can extract them by right clicking on the Markush and choose Extract Markush/Scaffold R-Groups. |
11.4.8 How to enumerate a Markush library. |
| Documentation |
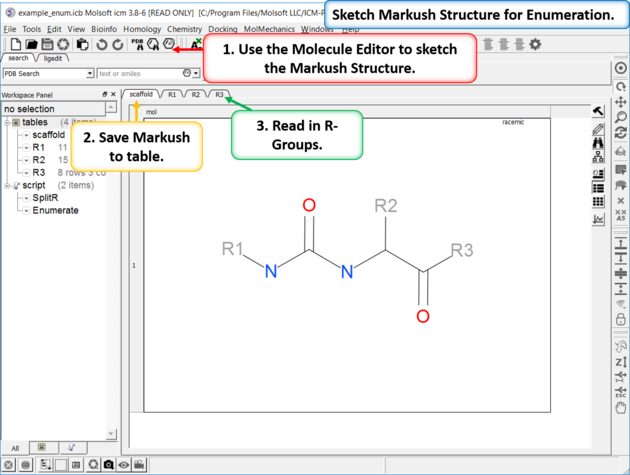 |
| Enumeration Setup A pre-prepared example is available in File/Open Examples > example_enum.icb. The markush structure has already been drawn and the R-groups have been read into ICM. The Markush structure is prepared for enumeration. |
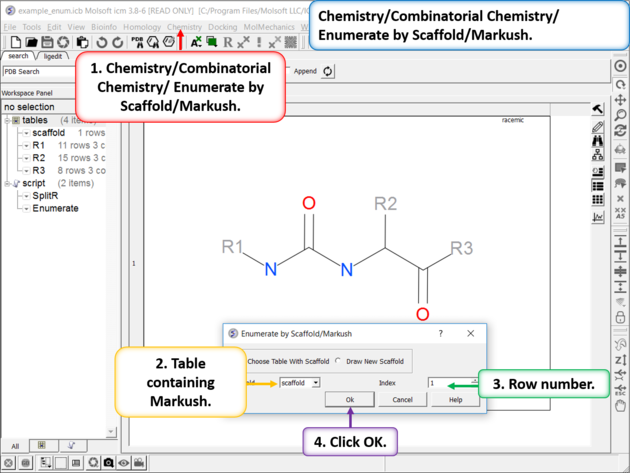 |
| Enumerate Library - Step 1: Choose the menu option Chemistry/Combinatorial Chemistry/ Enumerate by Scaffold/Markush. |
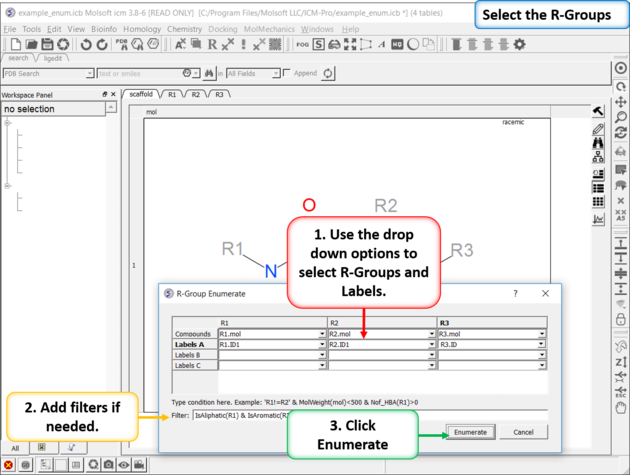 |
| Enumerate Library - Step 2: Select R-groups, labels and filters. |
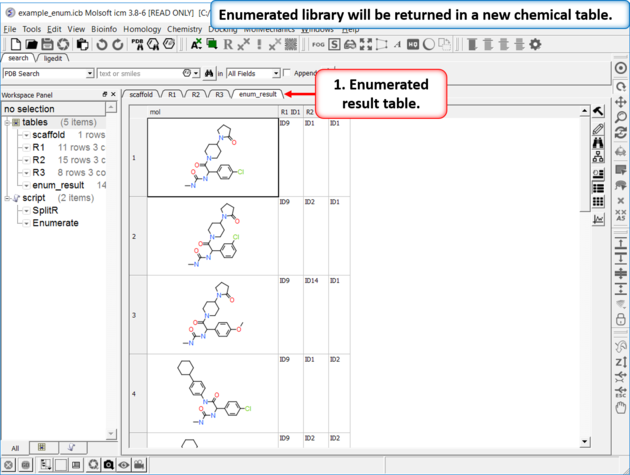 |
| Results Table The enumerated library will be displayed in a new chemical table. |
11.4.9 How to decompose a library based on a Markush structure. |
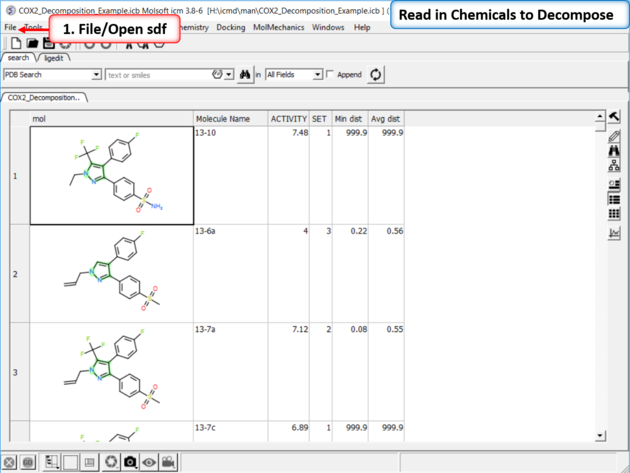 |
| Read in the SDF File to be decomposed. A prepared ICM file containing COX-2 inhibitors with a common scaffold and activity data can be downloaded from here: https://molsoft.com/addons/ftp/workshop (1. cut and paste the address into a web browser. 2. Right click on COX2_Decomposition_Example.icb and choose "Save Link As". 3. Open the .icb in ICM File/Open).
|
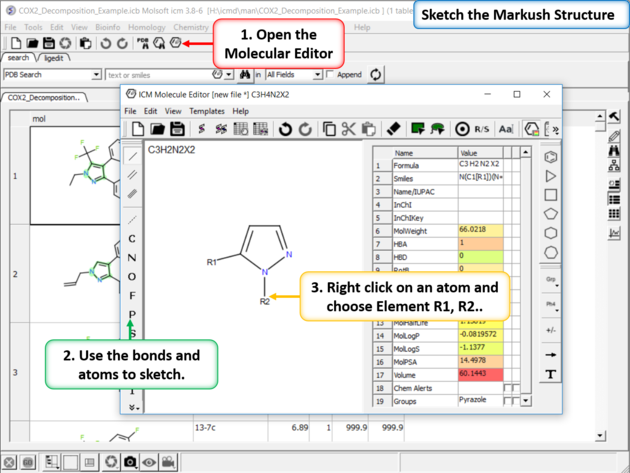 |
| Sketch the Markush Structure. Sketch the Markush structure using the Molecule Editor. |
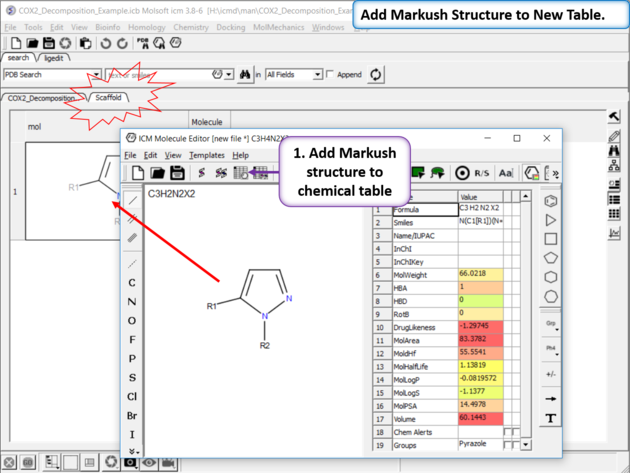 |
| Create Markush Structure Table Save the Markush structure to a new chemical table. |
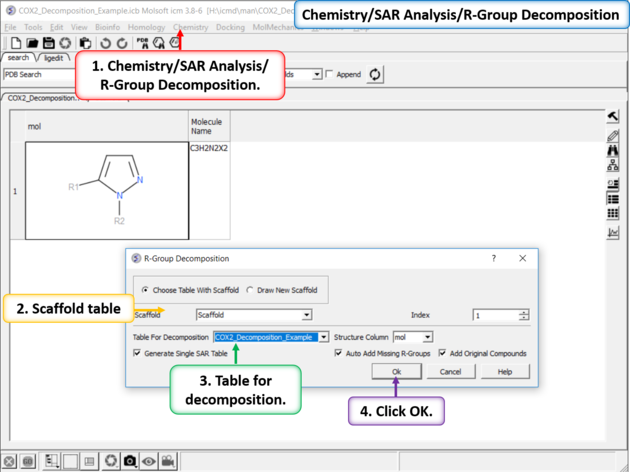 |
| Chemistry/SAR Analysis/ R-Group Decomposition. |
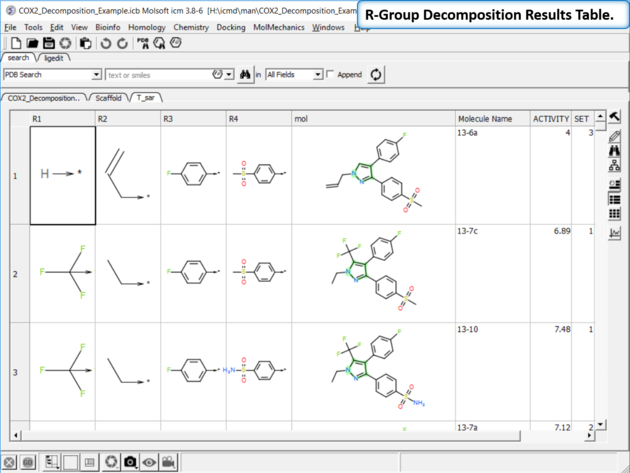 |
| Results Table. The decomposition data will be displayed in a new table. You can sort the columns by Actitiy or R-Group. The R-group decomposition can also be used to build more complex SAR tables as described here. |
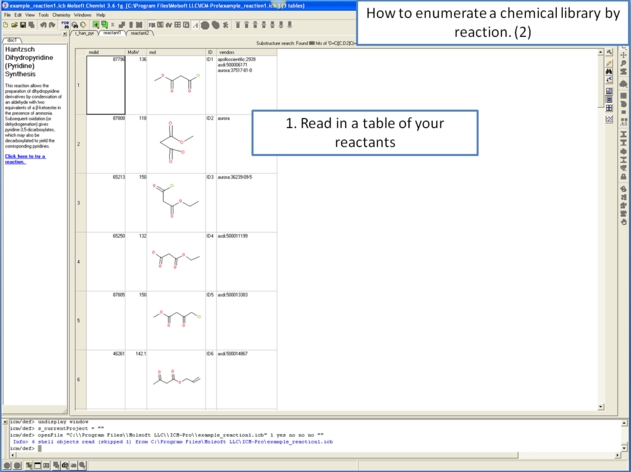
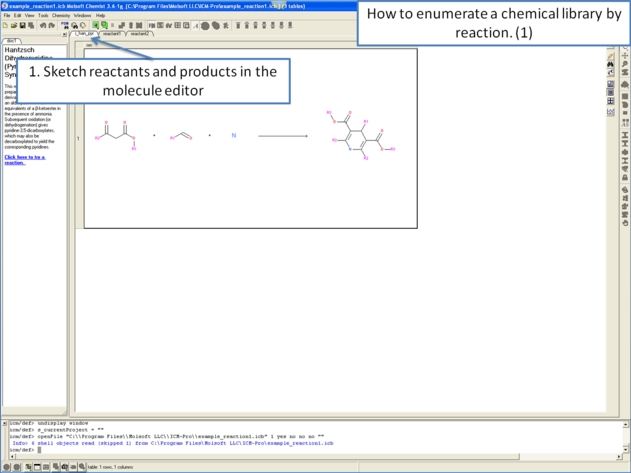
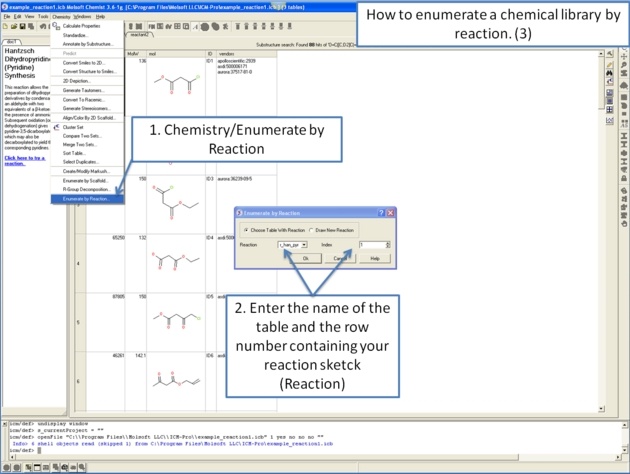
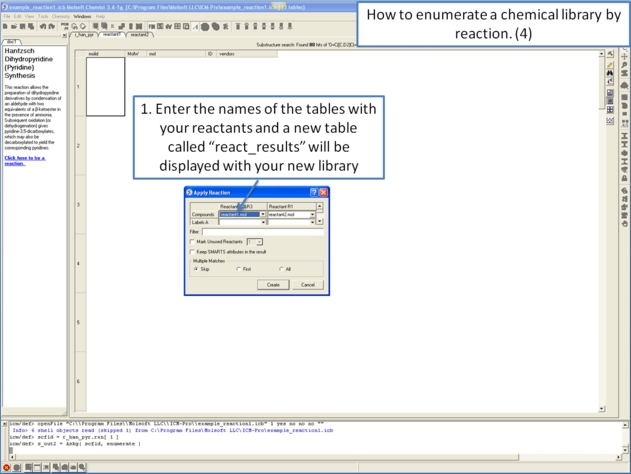
11.4.10 How to enumerate a chemical library by reaction. |
11.4.11 Detecting Activity Cliffs |
There are two methods to detect activity cliffs Matched Pair and Structure--activity landscape index(SALI).
The Matched Pair Analysis performs Maximum Common Substructure search on various pairs to find one-point variations in R-group. It returns a chemical spreadsheet with the delta difference in Activity and a score which is a combination of delta activity and size of R-group therefore looking for smaller R-groups with bigger activity difference.
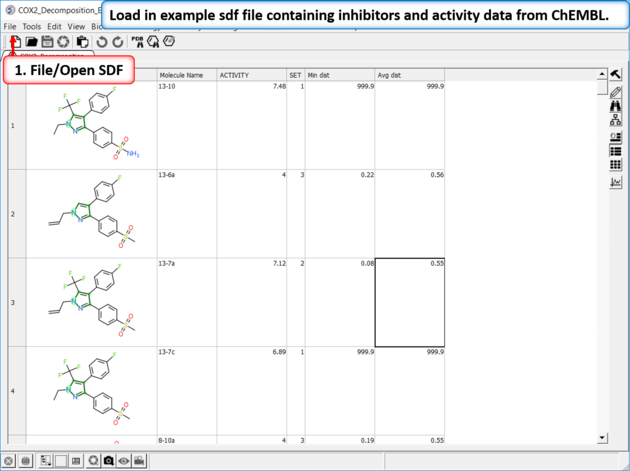 |
| Read in Activity Data A prepared ICM file containing COX-2 inhibitors with a common scaffold and activity data can be downloaded from here: https://molsoft.com/addons/ftp/workshop (1. cut and paste the address into a web browser. 2. Right click on COX2_Decomposition_Example.icb and choose "Save Link As". 3. Open the .icb in ICM File/Open). |
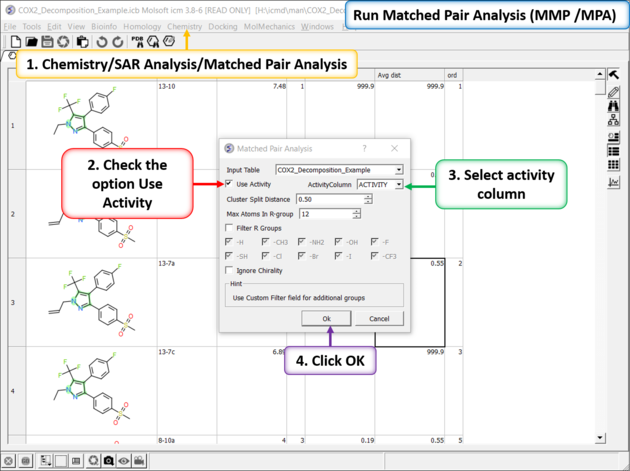 |
Run Matched Pair Analysis
|
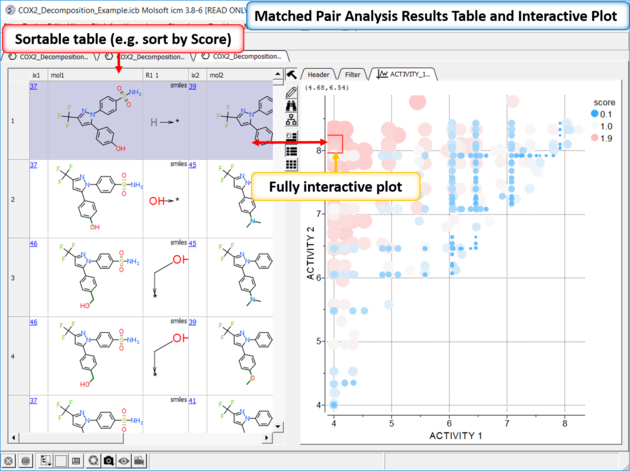 |
| *{Matched Pair Analysis Results} A table of the results will be displayed - you can sort by score. The plot is displayed activity 1 versus activity 2 colored and sized by score (red is better). The plot and the table are linked so a selection in one is propagated to the other. |
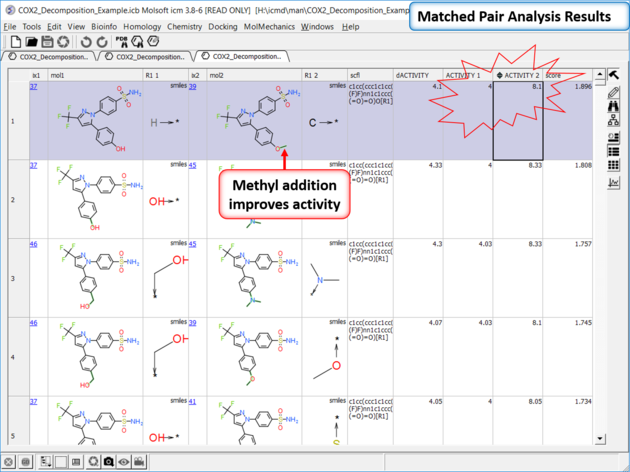 |
| Results Analysis The top scoring comparison shows that the addition of a methyl group significantly improves activity. You can also add filtering e.g. R1_2 filter and select methyl groups - right click on column header and choose filter. |
The SALI method developed by John Van Drie is calculated using chemical distances and activity and can identify different changes compared to MPA.
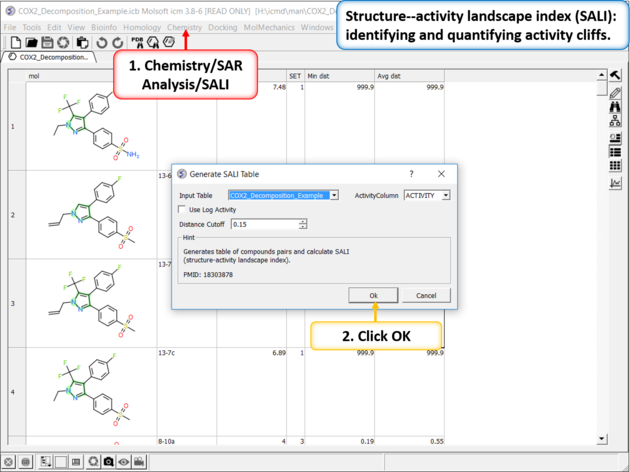 |
| Structure--activity landscape index (SALI): identifying and quantifying activity cliffs. Use the menu option Chemistry/SAR Analysis/SALI. |
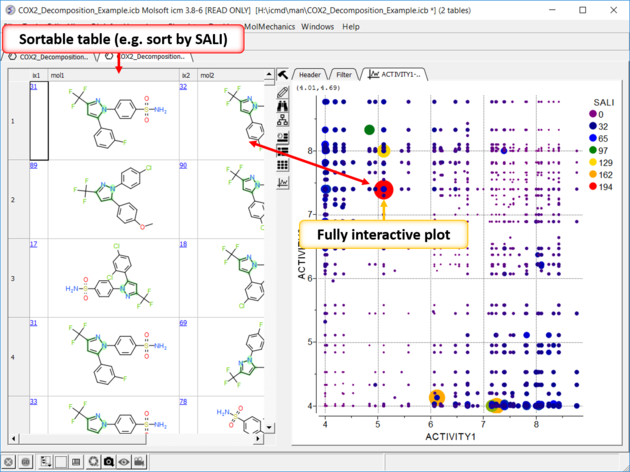 |
| SALI Results A fully interactive table and plot is returned containing the SALI index. |
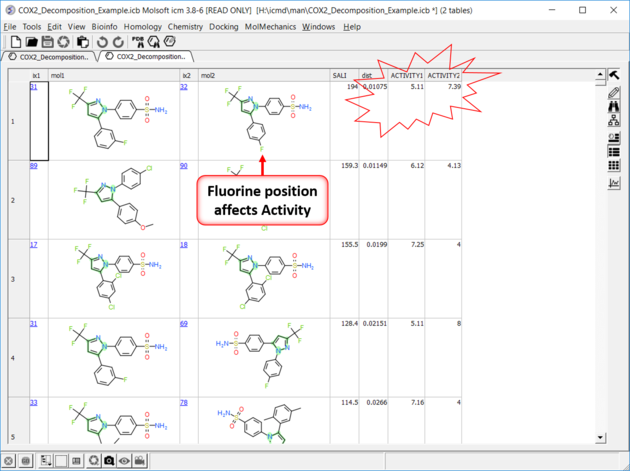 |
| Results In this example the fluorine movement around the ring affects activity. |
| Prev Biomolecule | Home Up | Next Graphics Tutorials |