ICM-Products Feature Comparison |
We do our best to keep this list as accurate as possible but please contact us if you have any questions about any particular features and we will be happy to answer any questions you have.
| Graphics and Display | ICM-Browser Free | ICM-Browser-Pro From $99 | ICM-Pro & Modules Contact Us | ICM-Chemist Contact Us | ICM-Chemist-Pro Contact Us |
| Graphics Options | |||||
| Read and display protein structures (e.g PDB) and chemicals (e.g. SDF and Mol2). | |||||
| Save publication quality images. | |||||
| Molecule representations: wire, xstick, cpk, ribbon | |||||
| Fog effect. | |||||
| Shadow effect. | |||||
| Side-by-side stereo. | |||||
| Adjustable perspective. | |||||
| Adjustable lighting. | |||||
| Residue and atom labeling. | |||||
| 2D and 3D user defined labels. | |||||
| Background images | |||||
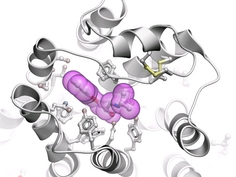
| Protein-Ligand Interaction Display | |||||
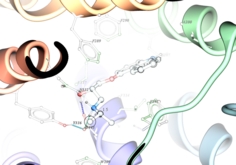
| One click ligand pocket display. | |||||
| Ligand pocket colored by binding properties. | |||||
| Ligand surface colored by binding properties. | |||||
| Color surface by proximity to Molecule. | |||||
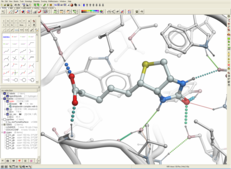
| Dynamic hydrogen bond display. | |||||
| Display intermolecular hydrogen bonds. | |||||
| Easy off and on display of hydrogen bonds. | |||||
| Export hydrogen bond list to table. | |||||
| Select hydrogen bond atom pairs. | |||||
| Change the representation of hyrdrogen bonds (e.g. dotted line, spheres, solid line, telescopic, even). | |||||
| Color hydrogen bond by energy (red strong-->blue weak) | |||||
| Change the representation of hydrogen bond style based on energy or atom size} | |||||
| Set the hydrogen bond minimum energy. | |||||
| Surfaces | |||||
| Display ligand binding pocket surfaces. | |||||
| Generate and display plain solid surfaces. | |||||
| Generate and display macroshapes | |||||
| Build electrostatic and binding property surfaces. | |||||
| Connect and rotate/translate mesh/surface. | |||||
| Resize or move mesh/surface. | |||||
| Crop mesh/surface. | |||||
| Save mesh/surface as wavefront object. | |||||
| Load and display 3D object files from Google Sketchup or in obj, kmz, dae, dmz, 3Dxml format. | |||||
| Movie Making | |||||
| Screen shot movie making. | |||||
| View defined movie making. | |||||
| Molecular Documents for Web and PowerPoint | ICM-Browser Free | ICM-Browser-Pro From $99 | ICM-Pro Contact Us | ICM-Chemist Contact Us | ICM-Chemist-Pro Contact Us |
| Build and save fully interactive molecular documents. | |||||
| Display fully interactive 3D documents in PowerPoint or the Web using free ActiveICM plugin. | |||||
| Memorize viewpoints and save slides. | |||||
| Edit, delete, overwrite and move slides. | |||||
| Memorize animations (e.g rocking, rotaion) | |||||
| Memorize transitions (e.g blend, smooth) | |||||
| Fully interruptable animations and transitions | |||||
| Create HTML documents. | |||||
| Create hyperlinks to 3D fully interactive slides. | |||||
| Insert images. | |||||
| Insert scripts. | |||||
| Insert dialog boxes and check boxes. | |||||
| Protein Structure Analysis | ICM-Browser Free | ICM-Browser-Pro From $99 | ICM-Pro Contact Us | ICM-Chemist Contact Us | ICM-Chemist-Pro Contact Us |
| Dynamic link to the Protein Data Bank | |||||
| One click search and download PDB structures. | |||||
| Search PDB by keyword. | |||||
| Search PDB by author. | |||||
| Search PDB by experiment type or resolution. | |||||
| Search PDB by Uniprot code. | |||||
| Search PDB by chemical smiles string. | |||||
| Search PDB by sequence pattern. | |||||
| Search PDB by sequence homology. | |||||
| Tabulated PDB data for easy manipulation, sorting and searching. | |||||
| Read and display all NMR models from a single PDB file in one click. | |||||
| Automatically display structure occupancy. | |||||
| One-click to extract PDB sequence. | |||||
| Find related chains in the PDB. | |||||
| PDB File Preparation | |||||
| Convert PDB to an ICM Object. | |||||
| Automatic but controled detection and fix of PDB problems. | |||||
| Add and optimize hydrogen atoms. | |||||
| Identification of optimal positions of added polar hydrogens. | |||||
| Assignment of the most isomeric form of histidine. | |||||
| Identification of the correct side-chain orientation of glutamine and asparagine. | |||||
| Display hydrogen bonds. | |||||
| Protein Superposition | |||||
| Superimpose multiple structures and calculate RMSD. | |||||
| On the fly graphical superposition. | |||||
| Superimpose by specific interatomic pairs. | |||||
| Superimpose by 3D strucure using visible atoms, C-Alpha, backbone or heavy atoms. | |||||
| Sequence alignment superposition. | |||||
| Superimpose multiple protein structures by alignment, residue number, exact match and by visible atoms, C-Alpha, backbone or heavy atoms. | |||||
| Weighted iterative superposition or single global supeposition for multiple proteins. | |||||
| Protein Structure Analysis | |||||
| Calculate protein-protein (inter/intra) contact area. | |||||
| Calculate protein-ligand contact area | |||||
| Display contact residues according to their contact area e.g. thick sticks for highest contact. | |||||
| Contact areas are tabulated in a fully-interactive clickable table. | |||||
| Calculate solvent accessible area of many different selection types. | |||||
| Surface area is tabulated in a fully-interactive clickable table. | |||||
| Measure distances between atoms (all to all, intermolecular or intramolecular).. | |||||
| Measure planar angles. | |||||
| Measure dihedral angles. | |||||
| Display and undisplay distances and angles in the graphical user interface. | |||||
| Build fully interactive clickable Ramachandran plots. | |||||
| Tablulate Phi, Psi, Omg angles. | |||||
| Save Ramachandran plot as a publication-quality image. | |||||
| Ligand Binding Pocket and Cavity Prediction | |||||
| Predict and display cavities. | |||||
| Predict and display ligand binding pockets. | |||||
| Calculate ligand pocket volume, area and radius. | |||||
| Volume and area of pockets displayed in fully interactive plot. | |||||
| References: An et al 1995, Nicola et al 2008 | |||||
| Protein-Protein Interaction Site Prediction | |||||
| Protein-protein interaction site prediction using the ICM Optimal Docking Area (ODA) method. | |||||
| Color the protein by protein-protein interaction hotspots. | |||||
| Tabulate the ODA prediction for each residue in a fully-interactive table. | |||||
| References: Fernandez-Recio et al 2005 | |||||
| Protein Health | |||||
| Calculate relative energy of each residue in a protein. | |||||
| Color selected residues by strain. | |||||
| Normalized Energy values for each residue are displayed in a fully interactive table. | |||||
| References: Maiorov and Abagyan 1998 | |||||
| Predict Side Chain Flexibility | |||||
| Systematically sample rotamers for each residue side-chain and uses the resulting ensemles to evaluate energy-weighted RMSD for every side-chain atom. | |||||
| Color the structure by side-chain flexibility. | |||||
| Conformational entropy for each residue side-chain is calculated and stored in a fully-interactive table. | |||||
| Crystallographic Analysis | |||||
| Crystallographic Neighbor | |||||
| Determine symmetry neighbors for a selection or complete PDB file. | |||||
| Define a radius around the selection from which you wish to construct symmetry related molecules. | |||||
| Append symmetry related molecules to one another. | |||||
| Display fragments of symmetry related molecules. | |||||
| Color individual symmetry related molecules a unique color. | |||||
| Crystallographic Cell | |||||
| Biomolecule Generator | |||||
| Direct link to the Uppsala Electron Density Server | |||||
| Contour electron density map. | |||||
| Contour electron density map according to selection at atom, residue, molecule or object level. | |||||
| Define sigma level for display, interactively adjust sigma level and display. | |||||
| Color contours according to sigma level. | |||||
| Display the original crystallographic cell of an electron density map. | |||||
| Convert electron density map to grid energy map for real space refinement. | |||||
| Bioinformatics | ICM-Browser Free | ICM-Browser-Pro From $99 | ICM-Pro Contact Us | ICM-Chemist Contact Us | ICM-Chemist-Pro Contact Us |
| Sequence Analysis | |||||
| Read in sequences and alignment in many different formats including FASTA. | |||||
| Direct link to the UniProt sequence database. | |||||
| Direct link to PFam. | |||||
| Calculate sequence residue content a table and graph of residue frwequencies will be displayed. | |||||
| Predict sequence secondary structure. | |||||
| Six frame translation. | |||||
| Set sequence type e.g Protein or DNA. | |||||
| Fully interactive sequence editor. | |||||
| Save sequence as an image. | |||||
| Save a sequence in a variety of formats. | |||||
| Sequence Alignments | |||||
| Align two sequences. | |||||
| Seven alignment comparison matrices to choose from. | |||||
| A variety of alignment methods available including ZEGA, H-align, Needleman-Wunsch, Smith-Waterman and Wilbur-Lipman. | |||||
| Adjust parameters such as Gap Open, Gap Extension. | |||||
| Perform sequence to structure alignment. | |||||
| Align DNA to Protein. | |||||
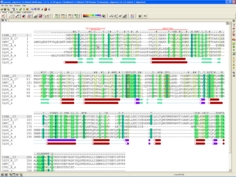
| Multiple Sequence Alignments | |||||
| Dynamic and feature-rich multiple sequence alignment editor. | |||||
| Easy drag and drop alignment construction. | |||||
| Link the alignment to 3D protein structures in the graphical display. e.g. select a region in the alignment and this selection will be propogated onto the protein structure. | |||||
| Extract a sub alignment. | |||||
| Cut a vertical alignment block. | |||||
| Reorder sequences in an alignment. | |||||
| Extract unique sequences. | |||||
| Hide/Show gaps in the alignment. | |||||
| Compress gaps in the alignment. | |||||
| Search in an alignment. | |||||
| Save and export a high quality image of the alignment. | |||||
| Copy the alignment to clipboard. | |||||
| Build a residue number table of the alignment. | |||||
| Build a residue label table of the alignnent. | |||||
| Cut a selected block of an alignment. | |||||
| Make a sequence QSAR table. | |||||
| Copy and paste selected regions of an alignment. | |||||
| Annotate regions of an alignment. | |||||
| Shade regions of an alignment. | |||||
| Change the font color in an alignment. | |||||
| Set fonts to bold. | |||||
| Draw a box around a region of an alignment. | |||||
| Add a title to an alignment. | |||||
| Display the consensus sequence of the alignment. | |||||
| Display the sequence profile at each point of the alignment. | |||||
| Display sequence ruler. | |||||
| Display sequence tree. | |||||
| Display the sequences in the alignment as unaligned. | |||||
| View differences in the alignment. | |||||
| Color the alignment by a variety of built-in and user-defined color schemes. For example you can adjust the consensus strength and color or color by hydrophobicity. | |||||
| Make complex selections in the alignment. This is helpful when the alignment is linked to a 3D structure. | |||||
| Display sequence secondary structure. | |||||
| Sequence Search | |||||
| ICM-Pro provides a fast tool to search any Blast-formatted database with a query sequence and generate an alignment on the fly. | |||||
| Search by sequence similarity. | |||||
| Search by sequence homology. | |||||
| Homology Modeling | ICM-Browser Free | ICM-Browser-Pro From $99 | ICM-Pro Contact Us | ICM-Chemist Contact Us | ICM-Chemist-Pro Contact Us |
| Sensitive sequence search for template identification. | |||||
| Fast model building - the algorithm builds the model with all loops in seconds. | |||||
| Local reliability prediction and model validation features. | |||||
| Model refinement using ICM global optimization. | |||||
| Membrane protein modeling. | |||||
| High-throughput homology modeling. | |||||
| Loop Modeling | |||||
| Sample loop conformations using BPMC | |||||
| Loop prediction based on loop database generated from the PDB | |||||
| Fully-interactive table of loop conformations ranked by energy is displayed. | |||||
| Click on the table to load loop conformation. | |||||
| Ligand Docking and Virtual Screening | ICM-Browser Free | ICM-Browser-Pro From $99 | ICM-Pro Contact Us | ICM-Chemist Contact Us | ICM-Chemist-Pro Contact Us |
| Dock ligands directly from a chemical spreadsheet. | |||||
| Dock a loaded ligand in 3D. | |||||
| Dock directly from Mol or SDF file. | |||||
| Dock up to 100 compounds at a time. If you need to dock more use ICM-VLS. | |||||
| Change length of docking simulation (thoroughness) | |||||
| Store alternative conformations. | |||||
| Post-Docking | |||||
| Multiple solutions ranked by energy. | |||||
| Interactively browse docking hits. | |||||
| Display ligand binding pocket whilst browsing. | |||||
| Display dynamic hydrogen bonds whilst browsing. | |||||
| Browse binding poses ranked by energy store in a stack. | |||||
| Template Docking | |||||
| Dock a ligand directly to a template small molecule in the binding site. | |||||
| Template match method options: substructure, atom name, fuzzy or Atomic Property Field. | |||||
| Dock to Electron Density | |||||
| Methods for incorporating Induced Fit | |||||
| Ligand guided docking. | |||||
| Explicit group docking. | |||||
| Multiple receptor docking (4D docking). Dock to many receptor conformation at one time to represent flexibility in the ligand binding site. | |||||
| Virtual Ligand Screening | |||||
| Fast and accurate docking and scoring procedure. | |||||
| Screen large databases from chemical vendors or directly from MolCart. | |||||
| Docking Preferences | |||||
| Sample racemic centers. | |||||
| Sample double bond cis trans. | |||||
| Relax covalent geometry. | |||||
| Flexible ring sampling. | |||||
| Keep carboxyls neutral. | |||||
| Charge group options: none, NH2, NH2NH, NH@ NH NT, imidazole or auto. | |||||
| A variey of binding site display options. | |||||
| Protein-Protein Docking | |||||
| Dock to specific epitopes on the surface of the receptor. | |||||
| Sample only specific epitope sites on the ligand. | |||||
| Dock to the whole receptor (if no binding site is predicted). | |||||
| Flexible ligand and receptor represented by maps. | |||||
| Flexible ligand-recptor refinement. | |||||
| Run multiple jobs on different machines in a cluster. | |||||
| Ranked results table with energy values displayed including - van der Waals grid potential, hydrogen bonding grid potential, electrostatics grid potential, hydrophobic potential, polar terms of the solvation energy, aliphatic terms of the solvation energy, romatic terms of the solvation energy and a weighted total of the solvation energy terms. | |||||
| Interactive 3D Ligand Editor | ICM-Browser Free | ICM-Browser-Pro From $99 | ICM-Pro Contact Us | ICM-Chemist Contact Us | ICM-Chemist-Pro Contact Us |
| Interactively edit a ligand bound to a receptor in 3D. | |||||
| Modify terminal atom with a chemical group (customizable groups). | |||||
| Fast building of heavy atom neighbors. | |||||
| Change atom properties. | |||||
| Join fragments by linkers. | |||||
| Change bond types. | |||||
| Edit ligand in 2D molecular editor. | |||||
| Delete atoms and bonds. | |||||
| Display hydrogen bonds, binding pocket, and atomic energy circles. | |||||
| Add edited ligands to table and save. | |||||
| Add edited ligands to chemical table and save. | |||||
| Convenient undo and redo modification feature. | |||||
| Minimize edited ligand. | |||||
| Dock and/or minimize edited ligand. | |||||
| On the fly docking and scoring of ligand or replacement groups. | |||||
| Fragment docking. | |||||
| Restrain parts of ligand during docking (tethered docking). | |||||
| Receptor side-chain refinement. | |||||
| In built ligand-receptor interaction display features. | |||||
| Molecular Mechanics | ICM-Browser Free | ICM-Browser-Pro From $99 | ICM-Pro Contact Us | ICM-Chemist Contact Us | ICM-Chemist-Pro Contact Us |
| Available Energy and Penalty Terms for Structure Prediction | |||||
| A variety of energy and grid terms are available which are described in detail here | |||||
| Set tethers restraints between atoms. | |||||
| Delete tethers. | |||||
| Set upper and lower boundaries of tethers. | |||||
| Set tether weights. | |||||
| Set tethers as a constant force. | |||||
| Set distance restraints between atoms. | |||||
| Minimization | |||||
| Minimize Cartesian in Merck Molecular Force Field (MMFF) | |||||
| Local minimization. | |||||
| Minimize all atoms. | |||||
| Minimize side chains. | |||||
| Minimize hydrogens. | |||||
| Minimize molecule position. | |||||
| Adjust length of minimization. | |||||
| Adjust a number of minimization parameters described here | |||||
| Biased Probability Monte Carlo Simulations | |||||
| Global optimization using the ICM Biased Probability Monte Carlo (BPMC) method (Abagyan et al 1994). | |||||
| Adjust a number of BPMC parameters described here | |||||
| Generate multiple receptor conformations (can be used in docking). | |||||
| Optimize side chains. | |||||
| Optimize ligand vicinity. | |||||
| Optimize hydrogen bonds. | |||||
| Force Fields | |||||
| Select from 4 different force fields, ecepp, ecepp05, icmff and mmff | |||||
| Set force field types and charges. | |||||
| Regularization | |||||
| Regularization options and features are described here | |||||
| Edit Molecule Structure | |||||
| Set bond type. | |||||
| Set formal charge. | |||||
| Set chirality. | |||||
| Build hydrogens. | |||||
| Set disulfide bonds. | |||||
| Make bonds. | |||||
| Make bonds by distance. | |||||
| Delete bonds. | |||||
| Set occupancy. | |||||
| Set B-factor. | |||||
| Make mutations and see the effect on energy of the structure or use for docking. | |||||
| Modify group. | |||||
| Randomize atoms. | |||||
| Collection of Molecule Conformations(Stack). | |||||
| View stack by loading a fully interactive clickable table. | |||||
| Play all stack conformations in a loop (movie-like). | |||||
| Add an additional conformation to an existing stack. | |||||
| Store stack in an object. | |||||
| Delete stack. | |||||
| Compare conformations in a stack. | |||||
| Recaluclate energies in a stack. | |||||
| Impose a conformation from a stack onto an object. | |||||
| Generate stack of normal mode backbone movements. | |||||
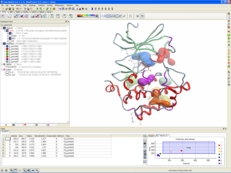
| Plotting Tools | |||||
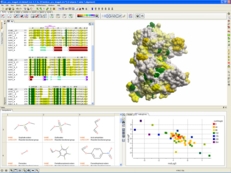
| Make fully interactive colorful X-Y plots and histograms with up to 4 dimensions. | |||||
| Save plot and histogram as image. | |||||
| Zoom in/out on one or both dimensions. | |||||
| Many plot customizing features including, mark size and shape, string labels, coloring, least square fitting line... | |||||
| Represent up to five dimensions of data using X-Y-color-size-shape. | |||||
| Selections made in plots are linked to the spreadsheet. | |||||
| Print plots. | |||||
| Cheminformatics | ICM-Browser Free | ICM-Browser-Pro From $99 | ICM-Pro Contact Us | ICM-Chemist Contact Us | ICM-Chemist-Pro Contact Us |
| Draw and Edit Chemicals | |||||
| Sketch bonds and atoms. | |||||
| Amino acid templates. | |||||
| Base templates. | |||||
| Bicyclic templates | |||||
| Ring templates. | |||||
| Template dictionary of drug compounds. | |||||
| Fully-customizable one-click templates | |||||
| Chemical properties are monitored on-the-fly as you sketch. Monitors are fully customizable. | |||||
| Monitor chemical formula, SMILES, International Union of Pure and Applied Chemistry (IUPAC Name), Molecular Weight, Number of Hydrogen Bond Acceptors, Number of Hydrogen Bond Donors, Number of Rotatable Bonds,DrugLikeness, Prediction model build for delta Hf in gas property, MolLogP, Polar Surface Area, MolLogS, MolVolume, Bad ADME-Tox Groups . | |||||
| One click annotation, and highlighting of chemical groups, and bad groups. | |||||
| Assign stereocenters. | |||||
| Append molecules to chemical spreadsheets, edit chemical spreadsheets in molecular editor. | |||||
| Append molecules to SDF file. | |||||
| Sketch 2D pharmacophores. | |||||
| Sketch Markush structures. | |||||
| Sketch chemical reactions. | |||||
| Add text labels to chemical sketches. | |||||
| Chemical Spreadsheets | |||||
| Display and manipulate multiple chemical spreadsheets. | |||||
| Custom view options: table, grid, and form views. | |||||
| Find and replace in chemical spreadsheet. | |||||
| Chemical transformations such as charging/discharging basic or acidic groups. | |||||
| Add new entries, insert/delete column or row. | |||||
| Column calculators such as MolWeight() LogP() as well as arithmetics (ColumnZ = ColumnX/ColumnY). | |||||
| Copy, cut, and paste column(s) or row(s). | |||||
| Show/Hide rows. | |||||
| Coloring columns by values contained within the cells. | |||||
| Label and color rows with fast keyboard shortcuts. | |||||
| Sorting and filtering data by column values. | |||||
| Insert hyperlinks automatically into a spreadsheet to connect to dataabses such as PDB, and PubMed. | |||||
| Align/color by 2D scaffold. | |||||
| Print table: individual entries, grid view. | |||||
| Copy/Paste 2D sketches as images. | |||||
| Copy/paste as SD for clipboard exchange with other programs. | |||||
| Intelligent support for special cases of numeric data, e.g. "No Data", >10. , <5. | |||||
| Merge multiple spreadsheets. | |||||
| Compare multiple spreadsheets: e.g. see overlap or see data only in first/second spreadsheet. | |||||
| Simple inline plots such as dose-response curves directly in a spreadsheet cell. | |||||
| Import new data columns from other spreadsheets matched by a column (such as ID). | |||||
| Edit chemical and other data types. | |||||
| Chemical spreadsheet standardization: remove salts, remove explicit hydrogens, and standardize groups. | |||||
| One click link to Microsoft Excel: Convert ICM chemical spreadsheets into Excel format including the chemical 2D sketch. | |||||
| Chemical Search | |||||
| Substructure search | |||||
| Fingerprint similarity search | |||||
| Similarity-Substructure combination search. | |||||
| Atom and bond property search | |||||
| SMILES and SMARTS pattern search. | |||||
| Exact match search. | |||||
| Search local spreadsheets (SDF, Mol files), local databases (Molt) or connect to a MolCart server. | |||||
| Filter by Tanimoto distance cutoffs, match salt, match stereo. | |||||
| Many customizable search rules such as: element, any aromatic, any aliphatic, any not carbon, any halogen, ring membership, ring size, charge, isotope, hybridization state, aromaticity, connectivity, define attachment point | |||||
| Various types of filters based upon the column content of the source file e.g. filter by chemical property such as molecular weight or string such as vendor name. | |||||
| Output search results to new chemical spreadsheet, sdf file or database. | |||||
| 2D and 3D Pharmacophore Searching | |||||
| Sketch a 2D pharmacophore include points such as hydrogen bond donor, acceptor, distance, aromatic, hydrophobic. | |||||
| Search 2D and 3D databases with a 2D pharmacophore search. | |||||
| Color 2D molecules by pharmacophore. | |||||
| Extract 3D pharmacophore points from a ligand. | |||||
| Extract 3D pharmacophore fragments from a ligand. | |||||
| Search 3D pharmacophores against databases containing 3D coordinates. | |||||
| Score 3D search hits and output results to chemical spreadsheets. | |||||
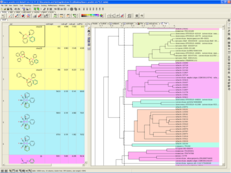
| Hierarchical Chemical Clustering and Trees | |||||
| A selection of linkage types including: UPGMA, UPGMC, WPGMA, WPGMC, complete and single linkage, farthest first clustering. | |||||
| Chemical clustering by Tanimoto distance as well as clustering of other data types. | |||||
| Chemical spreadsheet can be colored by cluster tree. | |||||
| Open/close clusters, reorder branches by field, and reorder spreadsheet by field. | |||||
| Extract representative "center" structures from each node. | |||||
| Print, save and export image of cluster tree. | |||||
| Edit individual nodes of tree e.g. labels. colors, spacing... | |||||
| Interactive branch reordering and distance changing. | |||||
| Generate Stereoisomers and Tautomers | |||||
| Generate stereoisomers. | |||||
| Generate tautomers. | |||||
| Filter energetically unfavorable tautomers. | |||||
| Preserve hybridisation upon tautomer generation. | |||||
| Convert racemic. | |||||
| Batch and interactive mode. | |||||
| Output results in a chemical spreadsheet with 3D coordinates. | |||||
| Easy conversion to 3D. | |||||
| Combinatorial Library Generation | |||||
| Generate focused compound libraries. | |||||
| Create or modify a Markush structure. | |||||
| Enumerate on-the-fly a new chemical database by adding chemical groups to defined R groups on a scaffold. | |||||
| Decompose a database into fragments. | |||||
| Enumerate by reaction. | |||||
| Store Large Chemical Libraries in Local Optimized Databases. | |||||
| Create database files from SDF, CSV/TSV, SMILES files and from ICM tables. | |||||
| Impose unique constraints on certain columns upon table creation to avoid redundancy. | |||||
| Store multiple tables in a single file; rename, delete tables in a database file. | |||||
| Search fast using advanced conditions, including advanced chemical search. | |||||
| Select diverse subsets from chemical database files. | |||||
| Browse database tables using flexible filtering and sorting conditions. | |||||
| Directly edit/delete/insert entries in the database. | |||||
| Export in popular formats, such as SDF (for chemistry) and CSV. | |||||
| Export and import tables to and from Molcart. | |||||
| QSAR. | |||||
| Build QSAR models | |||||
| Apply QSAR models | |||||
| Predict compound properties - LogP, LogS, PSA, hERG, aggregation, CYP3A4, druglikeness, reactive chemical groups, Heats of Formation, Lipinski, etc.. | |||||
| Various methods for linear and non-linear QSAR including, both regression and classification methods. | |||||
| Machine learning tools for regression or classification with the following kernels radial, scalar products, polynomial, sigmoid and tanimoto. | |||||
| Cross validation and boot-strapping. | |||||
| Save models and apply to large data sets. | |||||
| A comprehensive suite of interactive data plotting tools. | |||||
| Convert Chemicals to 3D | |||||
| Convert 2D chemical sketches (SDF or Mol) and Smiles to 3D. | |||||
| Optimize chemicals in the Merck Molecular Force Field. | |||||
| Easy browsing of 3D chemicals using a display on/off toggle (browser and lock) direct from chemical spreadsheet. | |||||
| Generate stereoisomers and tautomers. | |||||
| Convert chemicals to racemic form. | |||||
| All 3D conversion functions can be perfermed interactively or in batch mode. | |||||
| Chemical Superposition Tools. | |||||
| Rigid substructure superimpose. | |||||
| Flexible substructure superimpose. | |||||
| Atomic Property Field (APF) superposition. APF is a 3D pharmacophoric potential implemented on a grid. (See Totrov, Chem Biol Drug Des 2008) | |||||
| Multiple APF superposition. | |||||
| Superposition translated to selected atoms. | |||||
| Tethered superposition. | |||||
© 2026 All Rights Reserved MolSoft LLC Terms of Use | Privacy Policy