 |
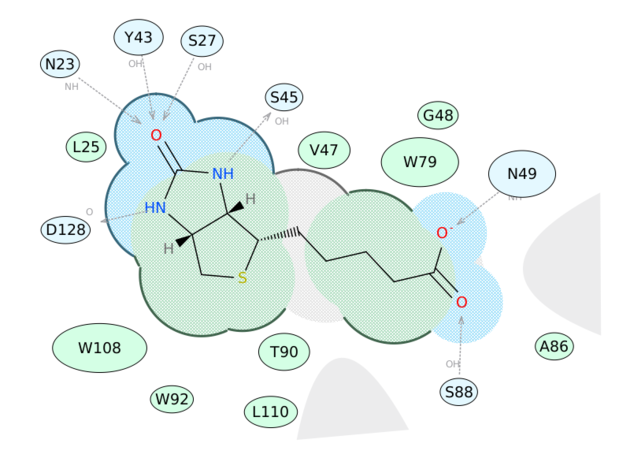
Generate a 2D Interaction Diagram of a ligand with the binding pocket. The image is annotated with hydrogen bonds and interacting residues. The residue interactions surface and proximity are represented by the size of the residue label and distance respectively. Grey parabolas and broken thick lines indicate solvent accessible regions and the ligand is shaded by property. [Documentation] | [Video]
A guide to the coloring and representation of the 2D display:
|
Return to ICM-Chemist Main Page
© 2026 All Rights Reserved MolSoft LLC Terms of Use | Privacy Policy


