To create a 2D interaction diagram between a ligand and receptor:
- Read into ICM a PDB file containing the ligand and receptor. For correct hydrogen bond assignment you will need to convert to an ICM object.
- Right click on the ligand and choose Tools/Ligand 2D Diagram.
- A dialog box will be displayed. Select the receptor object from the drop down button and allow ICM to Auto Detect the ligand if needed.
- The Hydrophobic Distance Cutoff is <= to the minimum distance between ligand and the closest atom in the residue. The Hydrogen Bond Strength is based on the GRAPHICS.hbondMinStrength parameter so lowering the value will identify weaker hydrogen bonds.
- An option is available to match the 2D representation to a pre-calculated one saved in a chemical table loaded into ICM.
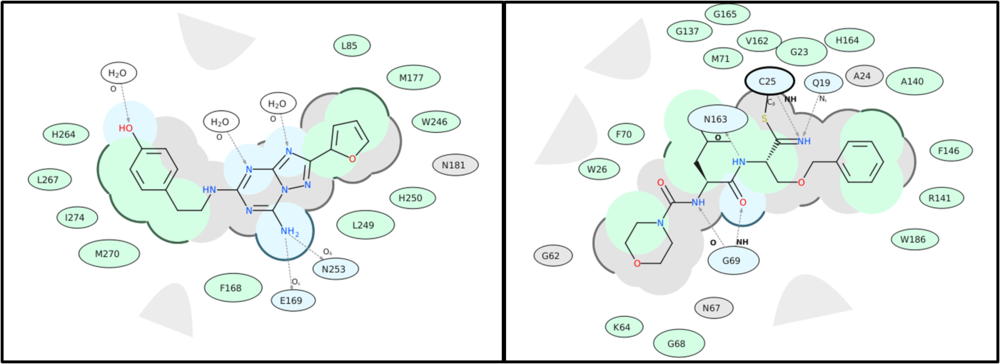
A guide to the coloring and representation of the 2D display:
- Green shading represents hydrophobic region.
- Blue shading represents hydrogen bond acceptor.
- White dashed arrows represents hydrogen bonds.
- Grey parabolas represents accessible surface for large areas.
- Grey residues represents "generic" van der Waals contact (non hydrophobic, non hbond)
- Broken thick line around ligand shape indicates accessible surface.
- Size of residue ellipse represents the strength of the contact.
- 2D distance between residue label and ligand represents proximity.
- Covalently bound residue represented with thick black line around ellipse. (C25 in the picture above)
- blue - HB interaction, green - hydrophobic, grey - other vw interaction
- Arrow points to the donor hydrogen. (if donor is an atom of the ligand then arrow will points towards it, otherwise towards receptor residue)
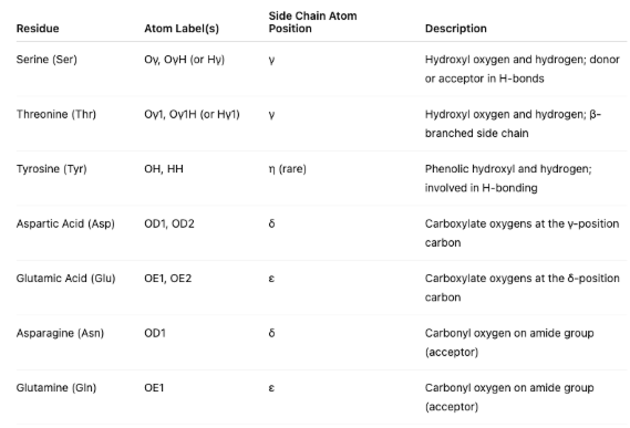
The plots also label side-chain oxygen atoms in amino acids that often participate in ligand-receptor interactions, particularly through hydrogen bonding or electrostatic contacts. The atom labels (e.g., Oγ, OD1) and their corresponding positions (using Greek notation) are frequently used in receptor-ligand diagrams to identify specific interaction sites and aid in interpreting hydrogen bond donors and acceptors within the binding pocket.
To edit the 2D image (e.g. rotate a group):
- Right click on the image and choose Edit Molecule and edit using the Molecular Editor.
To save the 2D interaction diagram to an image file:
- Right click on the image and choose Save Export/Molecular Image