| Prev | ICM User's Guide 7.5 3D QSAR Tutorial | Next |
| Documentation |
In this example we build a 3D QSAR model based on a set of Thyroid Hormone Receptor Alpha (THRA) inhibitors using Atomic Property Fields (APF). The example uses experimental pKd values from ChEMBL for the training set - the pKd values are also listed for the external test set so you can compare how good the model is. Both the test set and training set relies on 3D superimposed chemicals. In this example we have 8 THRA inhibitors from the PDB already superimposed and we will superimpose our training set and test set onto those. Template ligands from the PDB is the ideal scenario because it provides confidence in the conformation but if you do not have this you can use the best superposition for your lead compounds using the superimpose options described here.
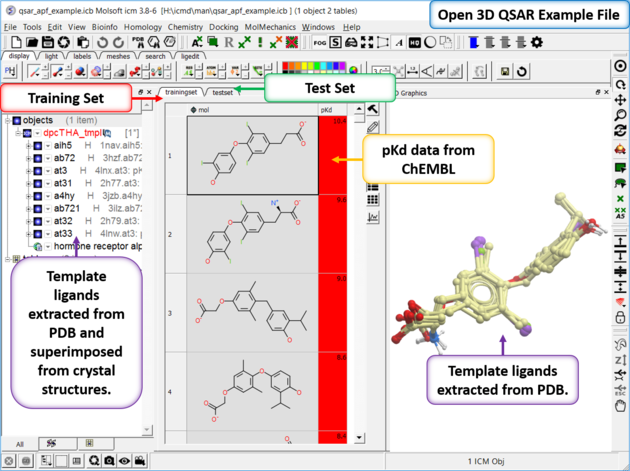 |
| Step 1: Download and open the prepared ICM file. The file can be downloaded here ftp://ftp.molsoft.com/pub/workshop/ (1. cut and paste the address into a web browser. 2. Right click on qsar_apf_example.icb and choose "Save Link As". 3. Open the .icb in ICM File/Open). Notice the file contains two tables: we will use TrainingSet to build the 3D QSAR model and testset table to test the model. Each table contains experimental pKd from ChEMBL. |
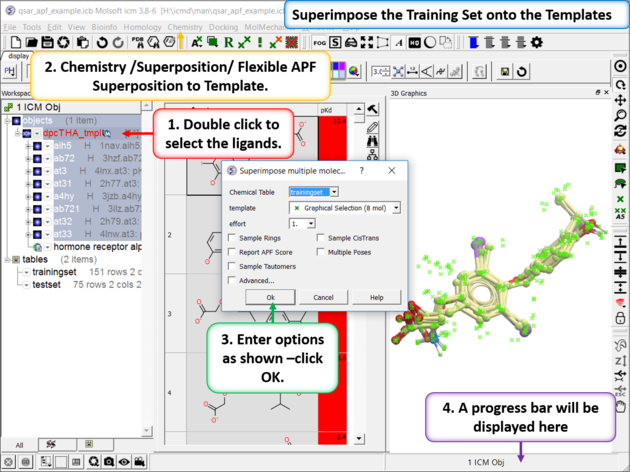 |
| Step 2: Superimpose the Training Set onto the Templates Select the template inhibitors in the ICM workspace. Go to Chemistry/Superposition/Flexible APF Superposition to Template menu option. Use the drop down dialog box to find the trainingset table. The template will be the selection other options are described here. |
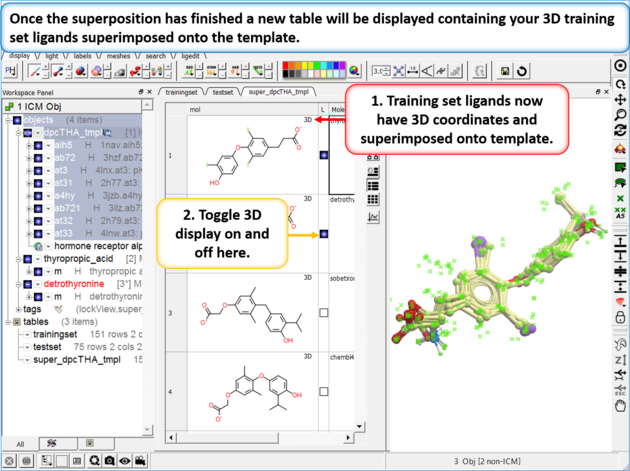 |
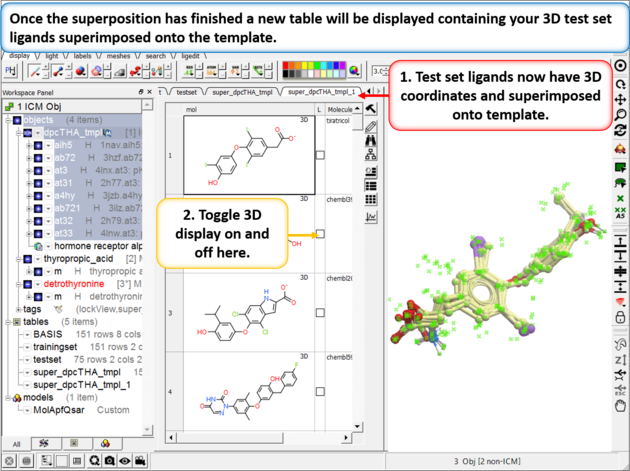
| Step 3: Once the superposition has finished you will see a new table containing the superimposed chemicals. The "L" column allows you to toggle the superposition display on or off. |
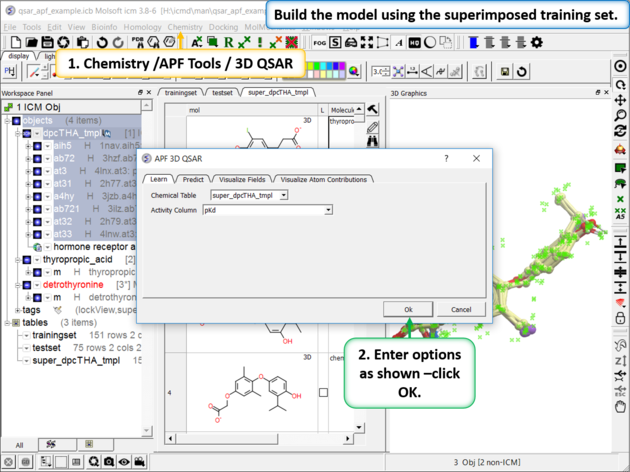 |
| Step 4: Build the Model Chemistry/APF Tools/3D QSAR |
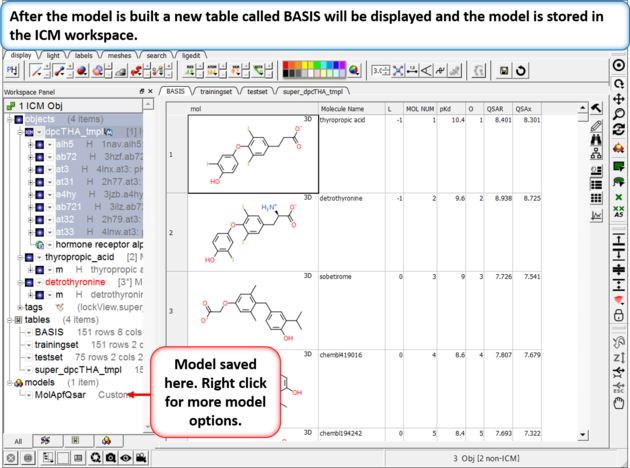 |
| Step 5: The model will be saved in the ICM workspace and a table called BASIS will be displayed containing the cross validation data. You can right click on the model in the ICM workspace to see the model properties. |
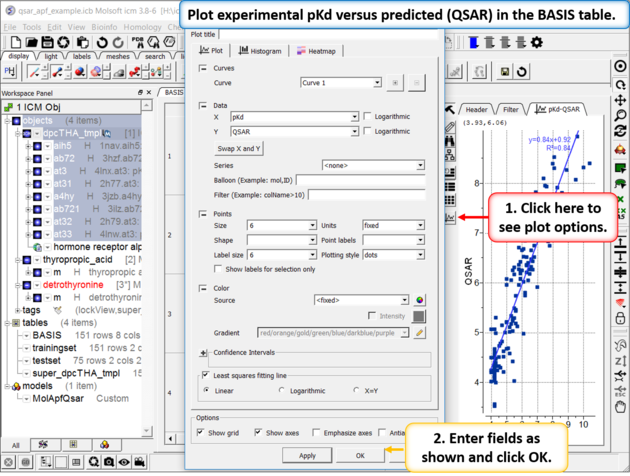 |
| Step 6: Plot experimental pKd versus predicted (QSAR olum in the BASIS table. You can choose the Least Square Fitting line and see the R2 value. Other statistics can be found by right clicking on the model in the ICM workspacec and choosing the option Model Properties. |
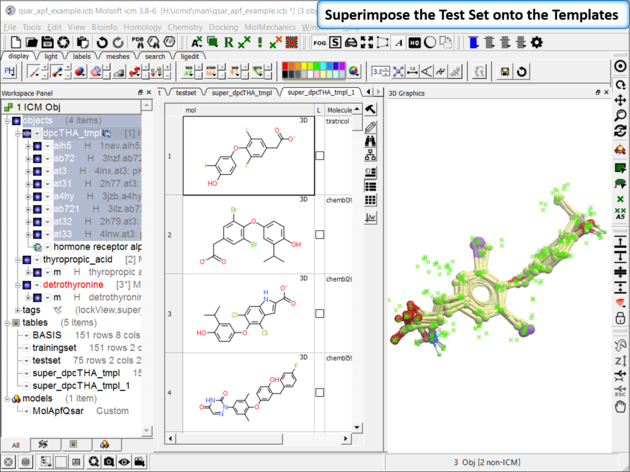 |
| Step 7: Superimpose External Test Set As with the training set the external test set in table "testset" needs to be superimposed onto the template. Go to Chemistry/Superposition/Flexible APF Superposition to Template menu option. |
 |
| Step 8: Check the superposition as before. |
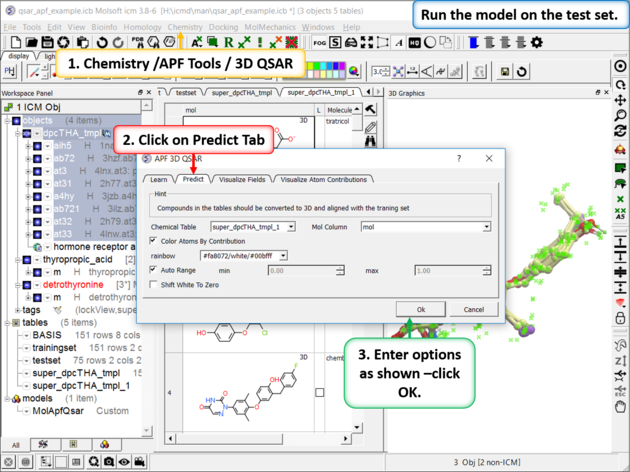 |
| Step 9: Run the model on the External Test Set Go to Chemistry/APF Tools/3D QSAR and select the "Predict" tab. |
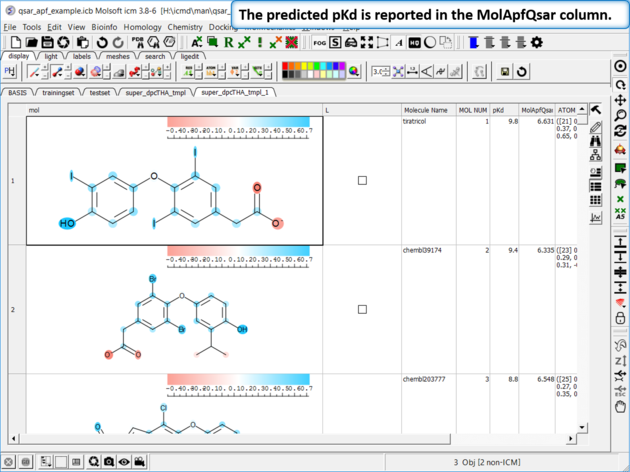 |
| Step 10: External Test Set Prediction Results The predicted pKd is reported in the MolApfQsar column. |
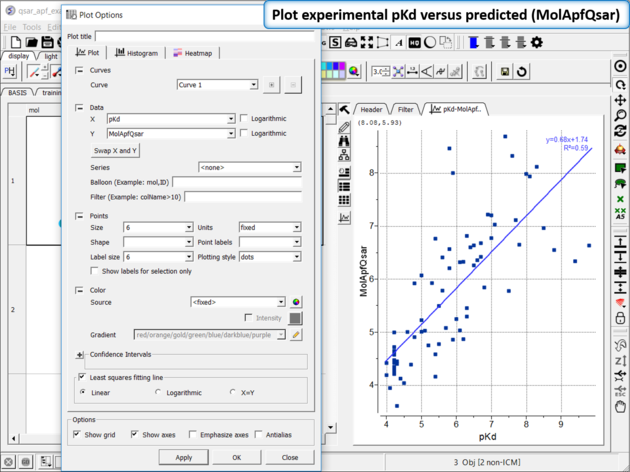 |
| Step 11: Plot experimental pKd versus predicted (MolApfQsar) and see the R2 value in the plot as shown above. |
| Prev 2D QSAR Model | Home Up | Next Graphics Tutorials |