Google Search: Keyword Search:
| Prev | ICM User's Guide 11.4 Evaluate Ligand Score and Strain | Next |
Video |
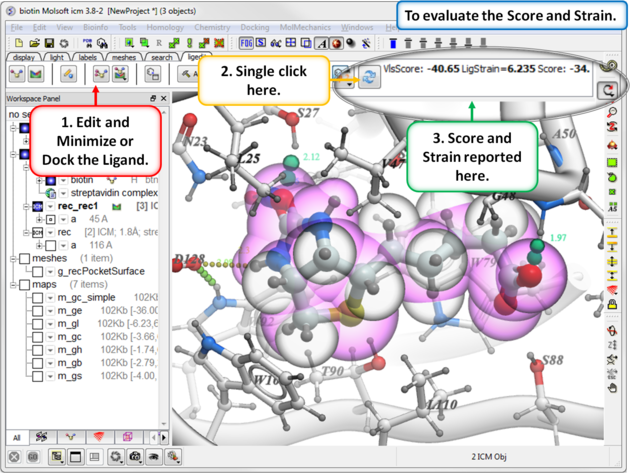
After you have edited a ligand and re-docked or minimized it you can evaluate the Score and Strain for the ligand. Ideally a good modification to your ligand will lower the score.
About the Score
You can read more about ICM's physics based Score and Neural Network Score here.
- Dock_Score This is ICM's physics-based Score - the lower the Score the better the predicted interaction.
- RTCNN_Score Radial Topological Convolutional Neural Net (RTCNN) This is ICM's Neural Network scoring function - you can read more about this score here. The lower the better the predicted interaction.
- LigStrain = The strain of the ligand in kcal/mol calculated using the Merck Molecular Force Field (MMFF). Lower values equals less strain.
- Click on the "Recalculate Binding Score Button".
About Strain If your docked ligand is strained e.g strain >5 then there are some things you can do to investigate the reason for this.
- Display the relaxed ligand in the ligand editor and check if there are there significant differences between relaxed and docked ligand.
- Display the energy circles - does that give any clues. This will display simple torsion circles visualization is limited to localized torsion strain such as amide bonds twisted out of plane.
Another way to discover where the strain stems from is to perform constrained cartesian relaxation (minimization) of the ligand and observe resulting movements: <> To do this:
- Make a copy of the ligand (molecule drop-down menu in workspace/Copy to another object)
- Make the copy current (object drop-down/Set to current)
- Perform minimization (Menu MolMechanics/Minimize/Cartesian)
Note that sometime strain is "global" i.e. it originates from the existence of a significantly lower energy conformer that is substantially distinct from the bound conformation. This is not readily visualizable, but can be better understood via conformational analysis of the free ligand (i.e. menu Chemistry/Generate 3D Conformers) and comparison of the bound conformation to the energy spectrum of free conformers.
| Prev Center | Home Up | Next Edit Ligand |