Google Search: Keyword Search:
| Prev | ICM User's Guide 15.3 Protein Structure Tutorials | Next |
[ PDB Search | Convert | Superimpose | Analysis | Contact Area | Hydrogen Bond | Pocket | Crystallographic Analysis Tools | PDB Preparation - Symmetry | PDB Preparation - Occupancy | PDB Preparation - Alternative Orientation | Biomolecule ]
Introduction
The positioning of the DFG motif in the activation loop of a protein kinase has an effect on the size and properties of the ATP binding pocket. Most kinase inhibitors target the kinase with the DFG inwards to the ATP binding site. Type-II inhibitors target the site where the DFG motif is in the out position which opens up the pocket and provides additional hydrophobic binding sites. Targeting DFG-out conformations can improve inhibitor specificity and slower-off rates.
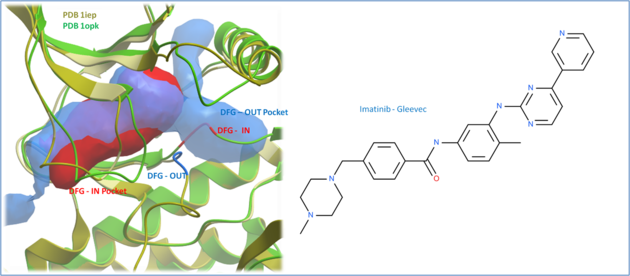 |
| Comparison of the crystal structures of Abl kinase with DFG-IN and DFG-OUT (Left). Imatinib (Gleevec - right) binds to the DFG-OUT conformation. |
Tutorial
In this example we will look at two kinase structures and compare their binding pockets. One of the structures is bound to the Type-II inhibitor Imatinib (Gleevec) a drug used to treat Chronic Myelogenous Leukemia. We will use ICM tools to look at the side-chains that interact with the inhibitor and compare the pocket with a DFG-in structure using ICMPocketFinder. Please click on the links provided to learn more about the methods used.
15.3.1 PDB Search |
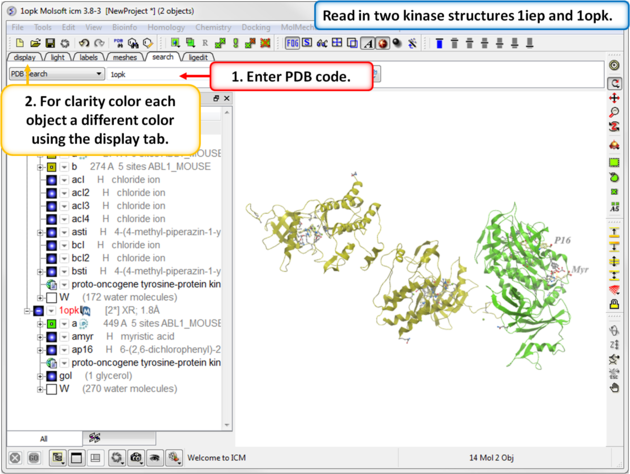 |
| Step 1: Click on the Search Tab and choose "PDB Search" and oad the PDBs structures 1iep and 1opk. You can color each object a unique color by clicking on the Display Tab and clicking and holding on the ribbon button and selecting Color by>Object. |
15.3.2 Convert PDB to ICM Object |
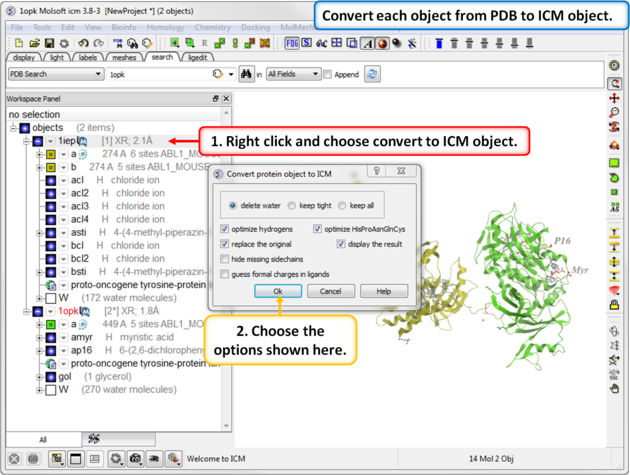 |
| Step 2: Convert each PDB file into an ICM object. |
15.3.3 Protein Superposition |
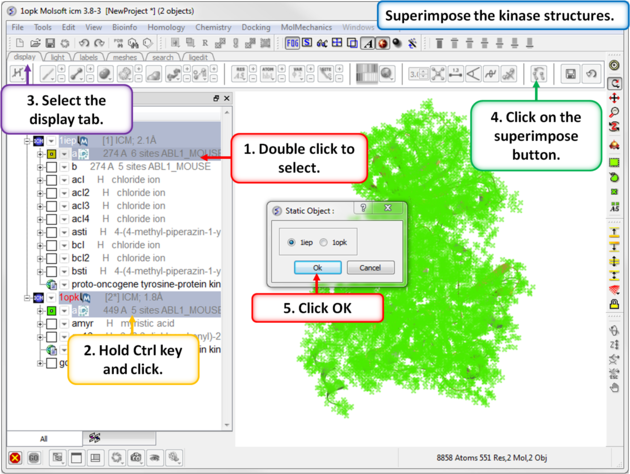 |
| Step 3: Superimpose the two kinase structures. |
15.3.4 Protein Structure Analysis |
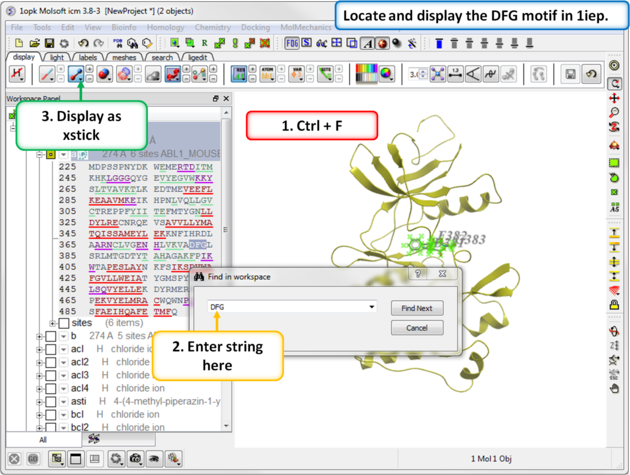 |
| Step 4: Search the "a" subunit of 1iep for the "DFG" motif. You can press Ctrl F and expand the sequence in the ICM workspace. Display the DFG region in xstick. |
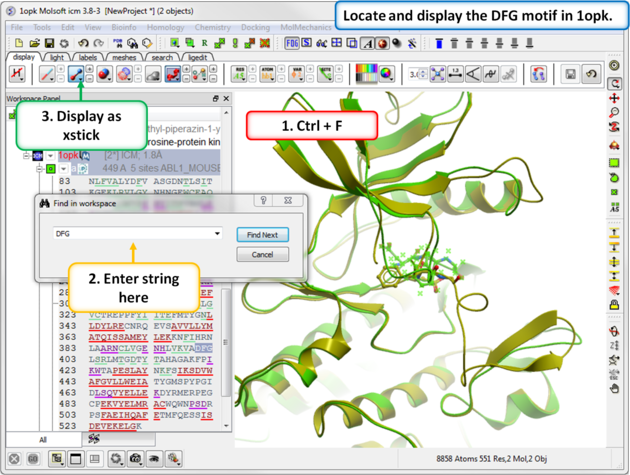 |
| Step 5: Search the "a" subunit of 1opk for the "DFG" motif. You can press Ctrl F and expand the sequence in the ICM workspace. Display the DFG region in xstick. |
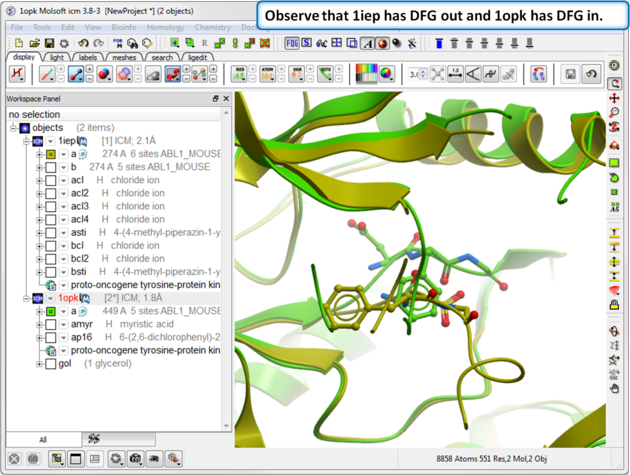 |
| Step 6: Observe the DFG location in both structures. |
15.3.5 Contact Areas |
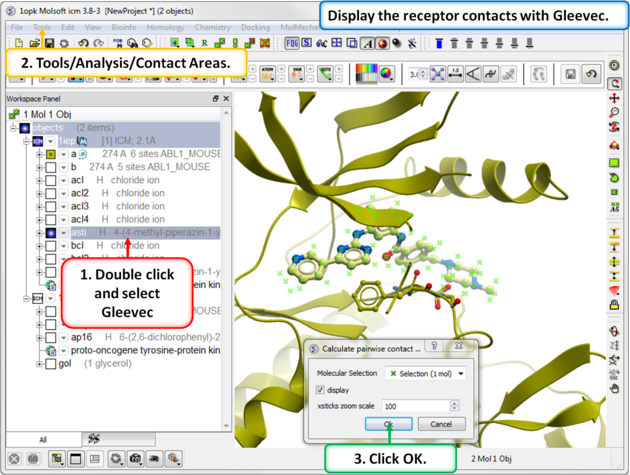 |
| Step 7: Use Tools/Analysis/Contact Areas to display the contacts with the Gleevec ligand. |
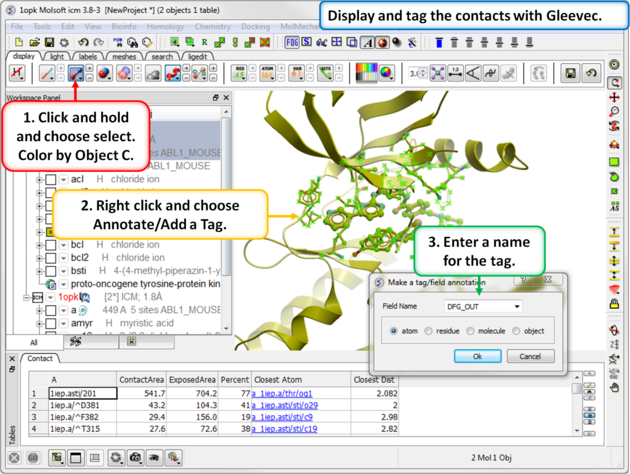 |
| Step 8: Tag the residues surrounding the ligand. Repeat Steps 7 and 8 for the 1opk structure and ligand. |
15.3.6 Hydrogen Bond |
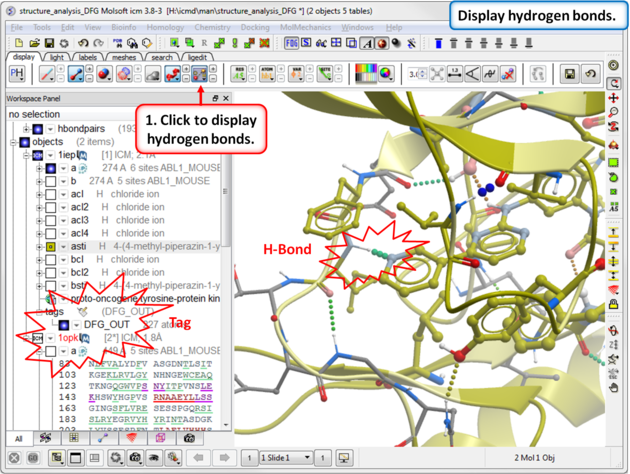 |
| Step 9: Compare the hydrogen bond interaction of the Type I and Type II inhibitors with the hinge region (1iep - residues 317:322) of the kinase. |
15.3.7 Pocket Identification |
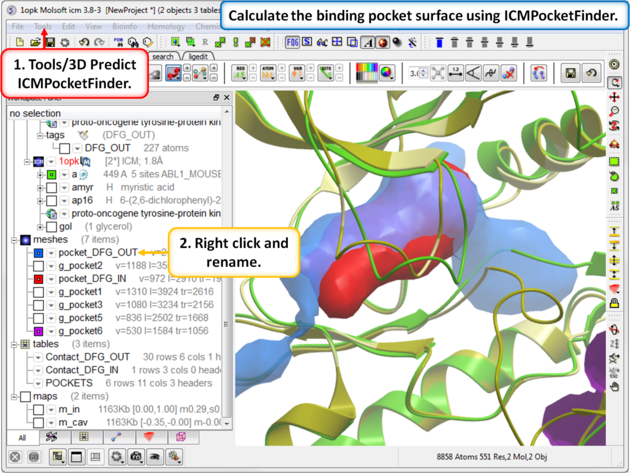 |
| Step 11: Use ICMPocketFinder to compare the pockets of DFG-IN and DFG-OUT. Run ICMPocketFinder for each structure - rename the pocket so as not to overwrite it. |
15.3.8 Protein Preparation and Crystallographic Analysis Tutorial |
15.3.9 PDB Preparation - Symmetry |
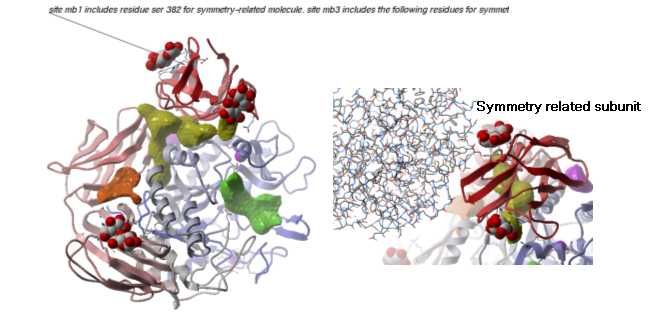
Background When inspecting a ligand binding pocket it is important to check that the true pocket is formed by chains which are not explicitly present in a PDB entry. Therefore it is necessary to use Tools/X Ray/Crystallographic Neighbor to find all molecules/subunits or chains involved in the interaction with the ligand. Molecular objects and 3D density maps may contain information about crystallographic symmetry. It consists of the following parameters:
- Crystallographic group eg. P2121 that determine N (depends on a group) transformations for the atoms in the asymmetric unit.
- Crystallographic cell parameters A, B, C, Alpha, Beta and Gamma
Example As an example let us look at Cycloldextrin glycosyltransferase (PDB Code: 1CDG). The problem with docking to this receptor is that the true pocket is formed by chains which are not explicitly present in the PDB entry. Site mb1 includes serine 382. This cannot be predicted just by looking at the structure. Therefore we need to identify symmetry related molecules to this protein.
- Use the PDB search tab to load the crystal structure 1cdg.
- Inspect the ligand binding pocket of maltose (mal)
- To identify if there are any other chains involved in the interaction with the ligand select the whole structure in the ICM Workspace.
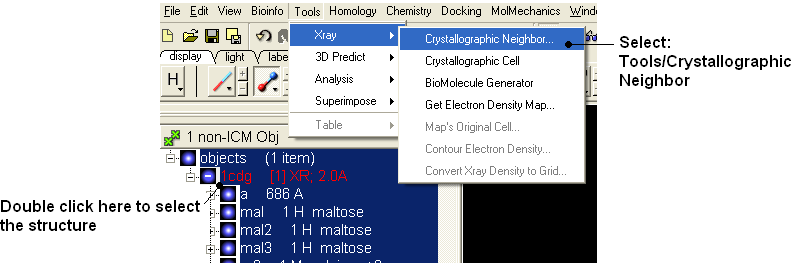
- Tools/Crystallographic Neighbor
- Select a 7A radius
- Check "create symmetry related molecules" and "display symmetry neighbors".
- Inspect the neighbors surrounding maltose(mal). Each symmetry related subunit can be colored by object by clicking and holding the representation button in the display tab and selecting color-by.
15.3.10 PDB Preparation - Occupancy and B-Factors |
Background When preparing a PDB for analysis (eg docking or modeling) it is important to check the reported occupancies and b-factors. The occupancy is a fraction of atomic density at a given center. If there are two equally occupied conformers both will have an occupancy of 0.5 - the normal value is 1 range 0-1. The *{B-Factor} is the mean-square displacement of atom from its position in the model - the normal range is 5-50.
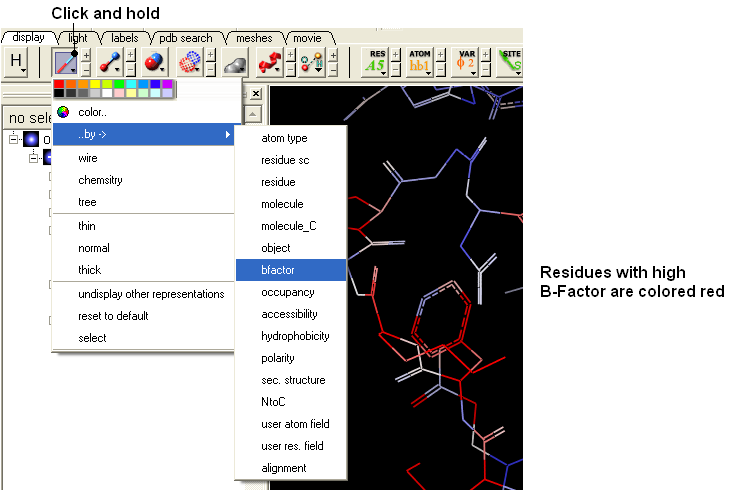
One way of visualizing the occupancy and b-factor is by coloring the structure by these values. You can do this by clicking and holding on a representation button in the display panel and selecting Color-by.
As an example let us look at the crystal structure 1ATP
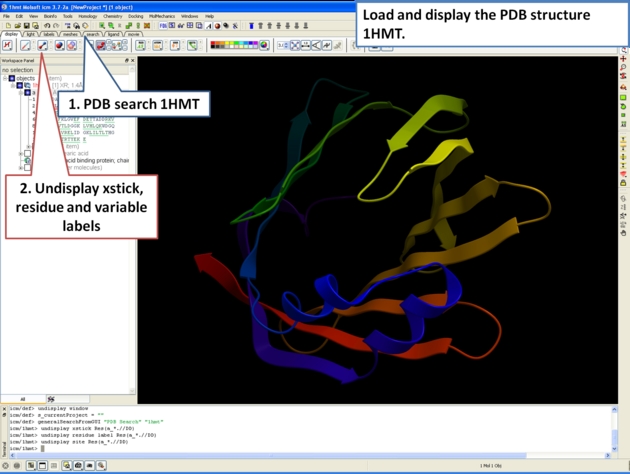
- Type in the PDB search tab 1atp and the structure will be displayed in the graphical display.
- Use the ICM workspace to undisplay everything except for the "e" subunit. You can do this by clicking in the blue boxes in the ICM Workspace.
- Display the "e" subunit in wire representation using the wire button in the display tab.
- Click and hold on the wire button and select Color-by B-Factor. Regions of high B-factor are colored red.
15.3.11 PDB Preparation - Residue Alternative Orientation |
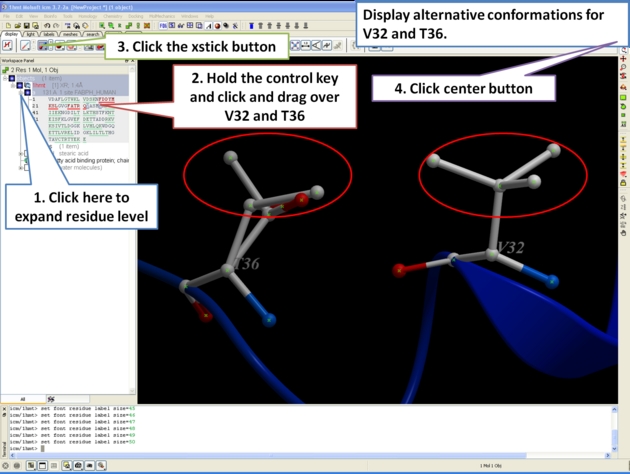
For some very high resolution structures two alternative conformations for a residue are provided. Therefore for docking you need to decide to use one conformation of the residue or generate seveal separate docking models. This could be performed using multiple receptor conformation docking.
Here is an example of alternative residue orientations found in a crystal structure of a Fatty Acid Binding protein in complex with stearic acid.
15.3.12 Biomolecule Generator |
Objective
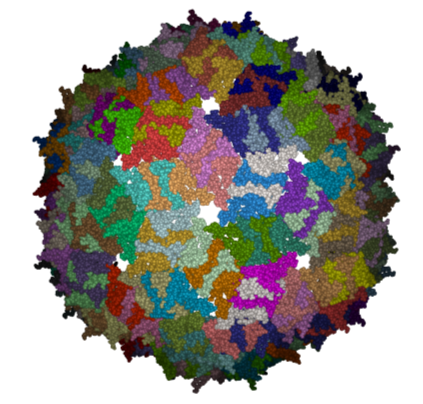
Here we will investigate the biological environment of a virus protein . PDB code 1DWN.
Background
It is very useful to know how a protein from the PDB may look in a biological environment. The PDB entries solved by X-ray crystallography and deposited in the PDB contain the information about the crystal structure rather than the biologically relevant structure. For example, for a viral capsid only one instance of capsid protein complex will be deposited and only one or two molecules of haemoglobin that is a tetramer in solution maybe deposited. In some other cases the asymmetric unit may contain more than one copy of a biologically monomeric protein. ICM reads the biological unit information and has a tool to generate a biological unit. Not every PDB entry has the biological unit information.
Instructions
- Read and load the PDB file 1DWN
- Tools/Xray/Biomolecule Generator
- Tick the makeAllBiomolecules box (Warning this may take a few minutes to generate)
- The generated molecules will be listed in the ICM Workspace. Each one can be selected and displayed. The biomolecule is shown below.
| NOTE: Please note that right clicking on a PDB file in the ICM Workspace will tell you whether there is any Biomolecule information available for the structure. If this information is not present then the option will be greyed out. |
Manual References (Web Links)
| Prev 3D Documents | Home Up | Next Cheminformatics Tutorials |