[ Concentration | Charge | List Species at pH ]
You can perform the following analysis of Protonation states vs pH using MolSoft's pKa Model:
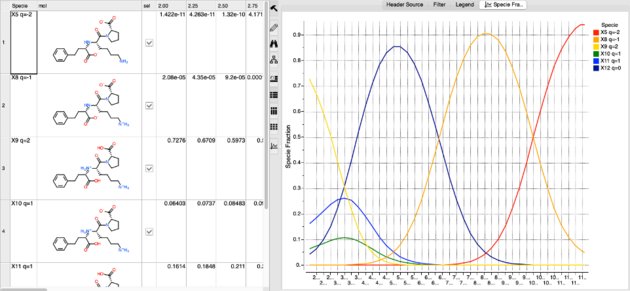
- Plot Concentration vs pH
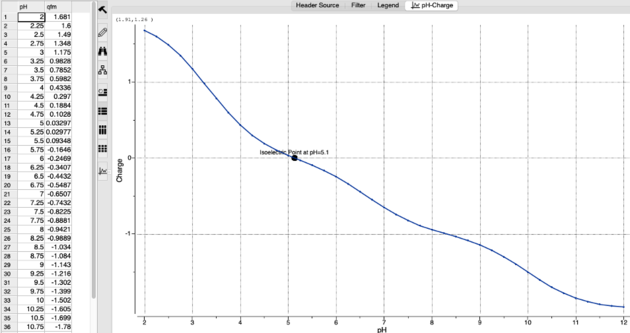
- Plot Charge vs pH
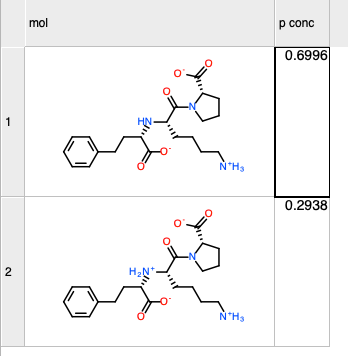
- List Species at pH
To do this:
- Read in a sd file or sketch the molecule of interest.
- Right click on the chemical and choose Chemistry/Protonation states vs pH
- Click on the tab for the analysis you want to undertake.
Concentration is percentage of that protonation form at certain pH. You may have mixture of of different species/states at some pH (e.g: 40% + 60%)
A table will be displayed with the Specie and concentration.