[ Crystallographic Neighbor | Crystallographic Cell | Biomolecule Generator | Get Electron Density Map | Map's Original cell | Contour Electron Density Map | Convert Xray Density to Grid ]
| Available in the following product(s): ICM-Browser-Pro | ICM-Pro |
Theory
Molecular objects and 3D density maps may contain information about crystallographic symmetry. It consists of the following parameters:
- Crystallographic group eg. P2121 that determine N (depends on a group) transformations for the atoms in the asymmetric unit.
- Crystallographic cell parameters A, B, C, Alpha, Beta and Gamma
To generate the coordinates within one cell one needs to apply N transformations and then to generate neigboring cells the content of one cell needs to be translated in space according to the cell position.
ICM has a function which generates crystallographic neighbors for the selected atoms. For large proteins it is impractical to generate neighbors for the whole molecule due to the high number of atoms in all neighboring molecules.
This information allows to generate symmetry related parts of the density or molecular objects.
To generate symmetry related molecules around a selection of atoms:
- Read a PDB file into ICM. For instruction see the section entitled Search PDB.
- Display the structure and select the residues around which the symmetry will be generated. For information on how to select residues see the Making Graphical Selections section.
- Select the menu Tools/Xray/Crystallograhic Neighbors.
A data entry box as shown below will be displayed.
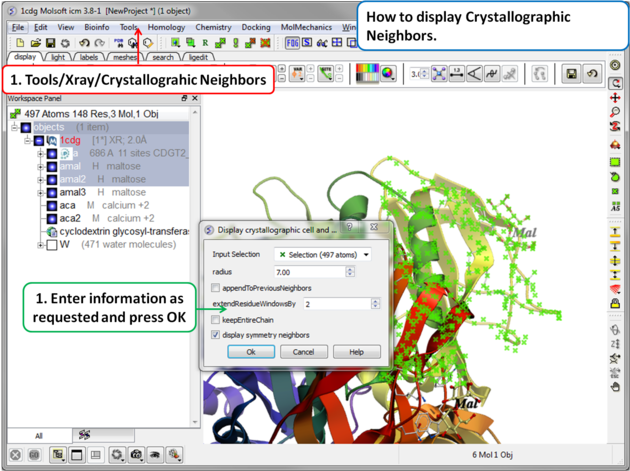
- Check that the selection is correct in the Input Selection box.
- Enter the radius around your selection from which you wish to construct the symmetry related molecules.
- If you have made symmetry related molecules previously you can select appendToPreviousNeighbors otherwise leave unchecked.
- The extendResidueWindowsBy option will allow a window of residues outside of the selection radius selected above to be displayed
- If you leave the keepEntireChain unchecked then a fragment of each neighbor will be created. If you check this box the full neighbor will be generated
- Check display symmetry neighbors to display them in the graphics window. The nearest neighbor residues will be displayed in xstick representation and the each neighbor colored by molecule.
- Click OK.
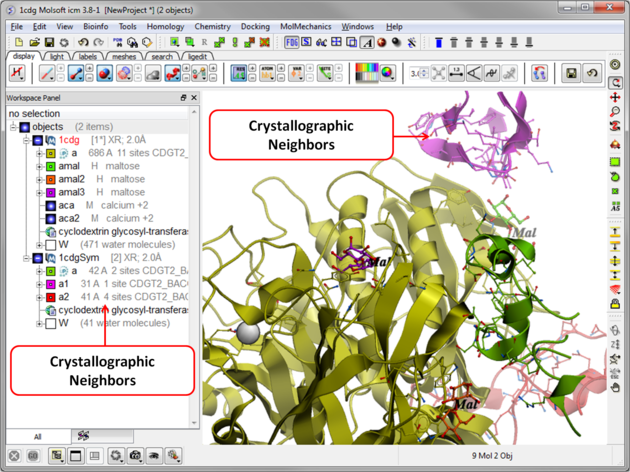
The crystallographic symmetry neighbors will be displayed in the Workspace. By default the object will have the object name + "Sym" and each of the neighbors will be individual molecules.
For packing analysis and display you can color each symmetry unit a different color as described in the Structural Representations Color section. This is shown in the picture below.
Theory
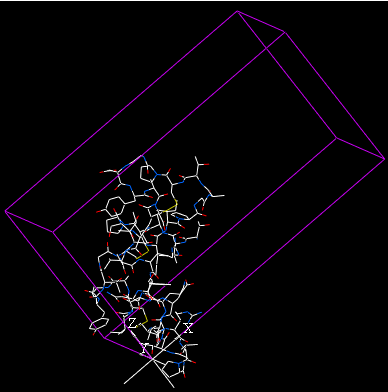
The crystal structure of a protein is often discussed in terms of its unit cell. The unit cell is a box containing one or more motifs, a spatial arrangement of atoms. The units cells are tiled in three-dimensional space to describe the crystal. The unit cell is given by its lattice parameters, the length of the cell edges and the angles between them, while the positions of the atoms inside the unit cell are described by the set of atomic positions measured from a lattice point.
To display the crystal cell of a PDB structure:
- Read a PDB file into ICM. For instruction see the section entitled Search PDB.
- Select the whole object. You can do this by double clicking on the name of the structure in the ICM Workspace (a selection is highlighted blue in the ICM Workspace and green crosses in the graphical display) or you can use the right-click button and drag it over the whole structure in the graphical display.
- Select the menu Tools/Xray/Crystallograhic Cell and a data entry box will be displayed.
- Click OK
The crystallographic cell will be displayed as a box as shown below.
Theory
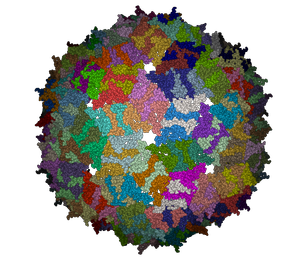
It is very useful to know how a protein from the PDB may look in a biological environment. The PDB entries solved by X-ray crystallography and deposited in the PDB contain the information about the crystal structure rather than the biologically relevant structure. For example, for a viral capsid only one instance of capsid protein complex will be deposited and only one or two molecules of haemoglobin that is a tetramer in solution maybe deposited.
In some other cases the asymmetric unit may contain more than one copy of a biologically monomeric protein. ICM reads the biological unit information and has a tool to generate a biological unit. Not every PDB entry has the biological unit information.
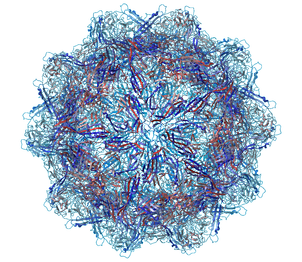
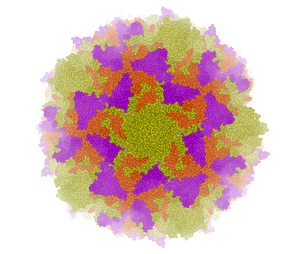
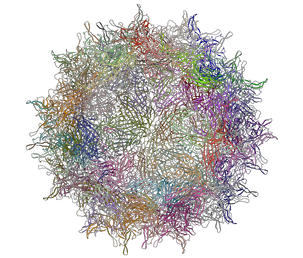
A gallery of images created using the ICM Biomolecule generator is shown below:
 | 
|
Left: PDB: 1DWN Bacteriophage Pp7 From Pseudomonas Aeruginosa At 3.7 A Resolution Right: PDB: 1C8E Feline Panleukopenia Virus Empty Capsid Structure At 3.0 A Resolution
|
Left: PDB: 1AL2 P1/Mahoney Poliovirus, Single Site Mutant V1160I At 2.9 A Resolution Right: PDB: 1LP3 Adeno-Associated Virus (Aav-2), A Vector For Human Gene Therapy At 3.0 A Resolution
| NOTE: Right click on a PDB structure in the ICM workspace to determine whether a structure from the PDB has biological unit information. If it does have this information then there will be an option in the menu entitled "Generate Biomolecules" if not the option will be blanked out. |
To generate a biological unit with ICM:
- Select the object or PDB file.
- Select the menu Tools/Xray/Biomolecule Generator.
- Tick the makeAllBiomolecules box.
- Click OK - with very large molecules the biomolecule generation may take some time.
Theory
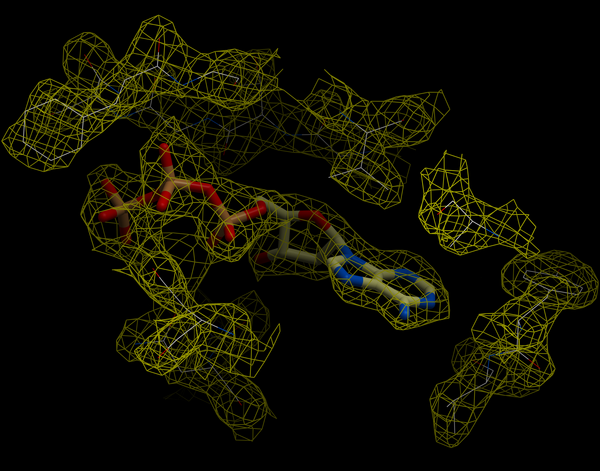
An electron density map is a representation of a crystal structure based on the diffraction data. The map is constructed by a summation of waves of known phase, amplitude and frequency using Fourier transform. The electron density map of a protein can be viewed along with the pdb structure. The easiest way to view the electron density map is to contour and convert it into a graphical object (mesh).
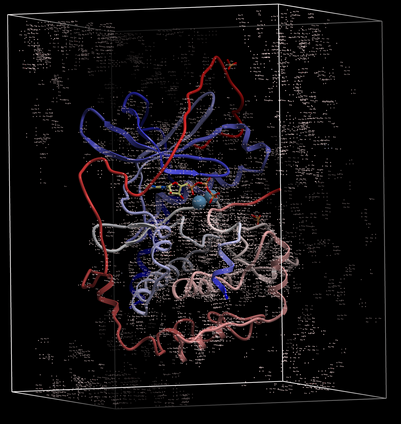
A figure showing the electron density contours surrounding the ATP molecule in pdb entry 1ATP.
To load an electron density map:
- Tools/Xray/Get Electron Density Map. You can choose to download the 2F0-FC or the F0-FC map. The 2F0-FC map is the main map used to build and validate the model, showing where electron density is expected based on experimental data and the current model. The F0-FC map is a difference map that highlights where the model is missing atoms (positive peaks) or has incorrect atoms (negative peaks), helping spot errors or unmodeled features.
- Enter the PDB code of the map you would like to view.
- Click OK and the map will be downloaded from the Uppsala Electron Density Server.
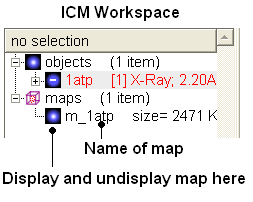
The map will be represented in the ICM Workspace as shown below.
The map can be displayed as shown below however a clearer way of representing the density is to contour the map into a graphical object (mesh) as described in the following section.
To display the original crystallographic cell of an electron density map:
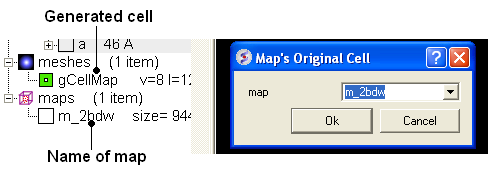
- Tools/Xray/Map's Original Cell
- Enter the name of the map or use the drop-down button to locate it. If you do not know the name of the map the name can be located in the ICM Workspace.
- Click OK and the cell will be displayed. The map can be displayed and undisplayed in the meshes section of the ICM Workspace.
To contour an electron density map and display as a graphical object:
- Load an electron density map as described earlier in the Load Map section.
- Read in the PDB file - File/Load PDB or use the PDB search tab.
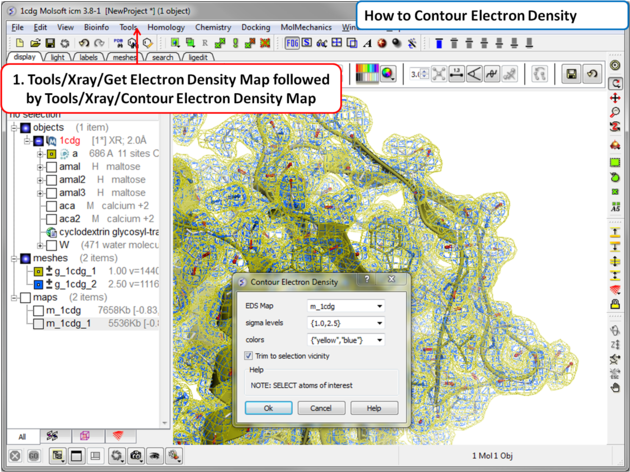
- Tools/Xray/Contour Electron Density.
- Enter the name of the map e.g. m_1cdg - the name of the map is displayed in the ICM Workspace or use the drop down arrow to locate it.
- If nothing is selected then the whole map will be contoured. If you only want to contour a particular region of the map then you need to select the region to be contoured (e.g.the binding pocket) and then select the option Trim to Selection Vicinity.
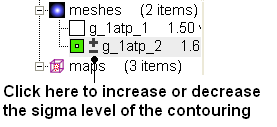
- Enter a sigmaLevel value for more information see: http://www.molsoft.com/man/reals.html#mapSigmaLevel. Once the contoured map has been created the sigma level can be changed manually using the +/- buttons in the ICM workspace. Two contour levels at 1 and 2.5 sigma respectively are generated for the 2Fo - Fc map
The sigma level can be changed interactively in the ICM workspace as shown below. The 2Fo - Fc electron density map is a commonly used map in macromolecular crystallography for evaluating how well the atomic model fits the experimental data. This map combines the observed structure factor amplitudes (Fo) with those calculated from the model (Fc), placing greater weight on the experimental data. It provides a clear and balanced representation of the electron density and is typically used during model building and refinement to guide the placement of atoms.
To assist in visual interpretation, the 2Fo - Fc map is often contoured at different sigma (σ) levels, which represent the number of standard deviations above the mean electron density. In this case, two contour levels are generated at 1σ (yellow) and 2.5σ (blue). The 1σ contour level highlights weaker features, such as partially occupied or flexible regions, while the 2.5σ level emphasizes stronger, more reliably interpreted density. Viewing both levels allows users to assess model accuracy and identify regions where further refinement or interpretation may be needed.
| NOTE: Meshes can be cut away using the mesh clipping tools. |
For some applications, such as trying to fit a structure to a density map, you may want to extract a sub map and convert to a grid. You can do this by
- First read into ICM a map (eg File/Open or Tools/X-ray/Get Electron Density Map)
- Tools/X-ray/Convert Xray Density to Grid
- Enter the map name or use the drop down list
- Enter a grid size
- Click OK