| Video |
Refining a virtual screening hitlist with molecular dynamics (MD) simulations can be highly beneficial, particularly when assessing the stability and realistic binding behavior of candidate compounds in complex with the target. While initial docking provides a static snapshot of ligand-protein interactions, MD allows for the exploration of dynamic, time-dependent effects, such as conformational flexibility and solvent effects, which are crucial for accurate binding predictions. Through MD, we can observe how ligands adjust within the binding pocket, monitor changes in the protein's structure, and detect transient interactions that might be missed in docking alone. By refining the hitlist with MD, we can prioritize compounds that not only bind well in static models but also exhibit sustained interactions in a more realistic, fluctuating environment. This extra layer of validation helps improve the reliability of hitlist rankings and reduce the risk of advancing false positives in drug discovery.
To run use the script runMDopenMM which is in /bin directory of the ICM distribution use the commands below in the terminal window. In preparation you need to save your hitlist in .icb format (right click on the hitlist table tab and choose Save as... .icb) and you need to save your receptor as an ICM object.
$ICMHOME/icm64 $ICMHOME/bin/runMDopenMM.icm -w time=5.0 confs=20 -m -rl ligfile=<hitlist>.icb <receptor>.ob
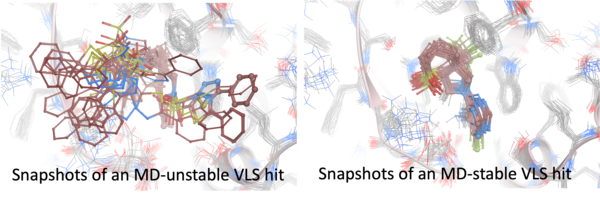
Ligands are scored using the ICM physics-based scoring method and the RTCNN neural network score, with RTCNN offering faster performance. Evaluation primarily focuses on the stability of the pose and its RTCNN score. The MD_RMSD0_mean metric is used to measure deviations from the initial pose, with preferred ligands remaining within approximately 1.0-1.2 Å. This threshold may be adjusted based on the binding site, being more stringent for enclosed pockets and more flexible for open sites. Stable complexes are characterized by maintaining favorable interactions and consistent scores during the simulation, which can be assessed using the MD_RTCNN_mean metric.
Guide to the results columns
After a molecular dynamics simulation, ICM adds several analysis columns to the hit list. These can be used to assess whether the docked ligand remains stable during the simulation and whether favorable protein-ligand interactions are maintained.
- RMSD0 is calculated relative to the initial pose supplied to the simulation, typically the original docking pose. It therefore measures how much the ligand moves away from the docked pose during the simulation. A low RMSD0 indicates that the original docking pose is largely maintained.
- RMSD is calculated relative to the snapshot taken after approximately one third of the simulation time. The idea is that the ligand may undergo some initial relaxation from the exact docking pose, but if the pose is being refined it should subsequently stabilize. It is therefore possible to observe a relatively high RMSD0 together with a low RMSD. This can indicate that the ligand has moved away from the original docking pose but has settled into a new, stable pose.
- tcov values are time covariances and provide an indication of continuous drift towards higher or lower values during the simulation. A value close to zero indicates little systematic drift. For RMSD measurements, a positive _tcov value indicates that the RMSD is tending to increase with time.
- RTCNN is the ICM neural-network docking score calculated repeatedly for snapshots throughout the MD trajectory. It provides an indication of whether favorable protein-ligand interactions are maintained during the simulation. Lower, more negative RTCNN values are generally more favorable.
- Success indicates whether the MD run completed successfully and produced a trajectory. When running large numbers of simulations, a small fraction of runs may terminate because of numerical failures. These are marked with 0 in the success column.
For RMSD0, RMSD and RTCNN, the results include the mean value, fluctuation, minimum, maximum and time covariance. The final column in each group contains a plot showing how the corresponding value changes throughout the trajectory.
Summary
Taken together, these values provide complementary information about the stability and quality of the ligand pose during the simulation:
- RMSD0 indicates whether the ligand remains close to the original docking pose.
- RMSD indicates whether the ligand stabilizes after the initial relaxation period.
- RTCNN indicates whether favorable protein-ligand interactions are maintained during the simulation.
- Success indicates whether the simulation completed successfully and produced a trajectory.