[ Multiple Receptor | Explicit Group ]
| Additional Resources: GUI Docs |
Background
Here we will demonstrate multiple receptor conformation docking in ICM using Aldose Reductase as an example. Aldose Reductase has a flexible loop in the ligand binding pocket vicinity which enables a variety of inhibitors to bind therefore in order to identify these ligands via docking it is necessary to sample the conformations of this loop and dock to an ensemble of structures. This example demonstrates that a single conformation of the Aldose Reductase receptor cannot account for the binding of all known aldose reductase inhibitors. To account for the flexibility we model the flexible loop and then dock using ICM Multiple Receptor Conformation (4D) docking. You can read more about 4D docking and other methods for incorporating induced fit here.
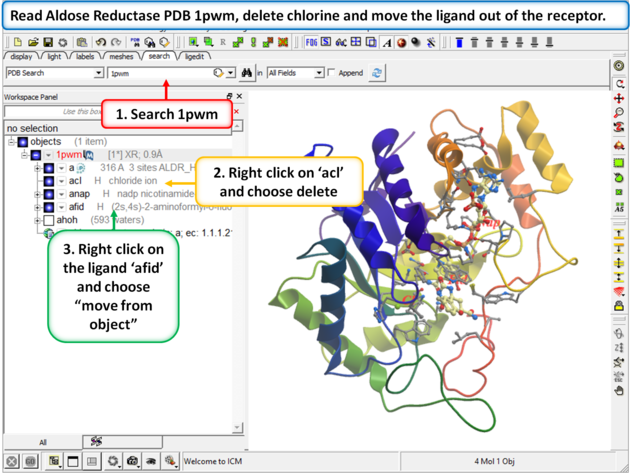 |
Step 1:
|
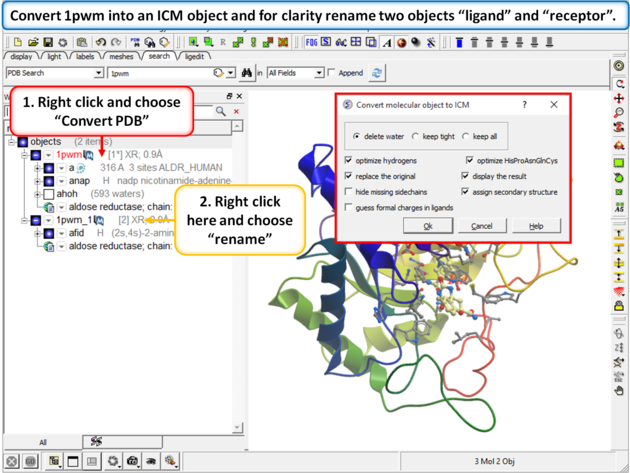 |
| Step 2: Convert 1pwm into an ICM object. * Rename the small molecule (fid) object "ligand" and the receptor object "receptor". You can rename an object by right clicking on the name of the object in the ICM Workspace and select rename. |
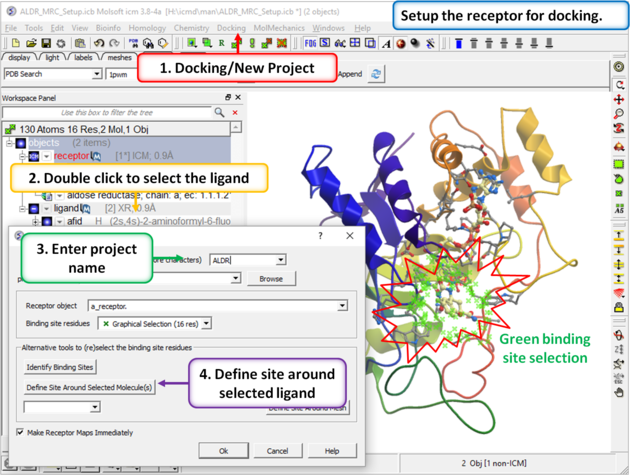 |
| Step 3: Setup the docking project using the ligand to guide the binding site. Double click on the ligand in the ICM Workspace and then select the Define Site Around Selected Ligand button (you should see green crosses surrounding the ligand on the receptor). |
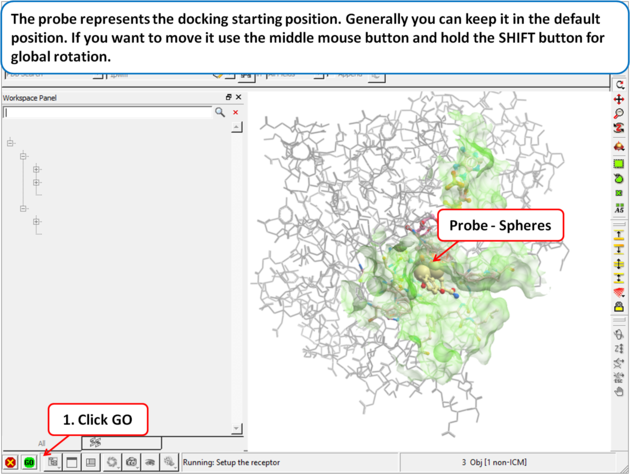 |
| Step 4: The probe represents the docking starting position. Generally you can keep it in the default position. If you want to move it use the middle mouse button and hold the SHIFT button for global rotation. |
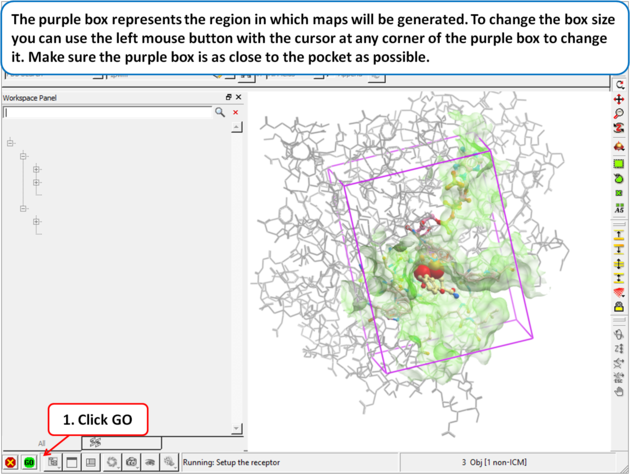 |
| Step 5: The purple box represents the region in which maps will be generated. To change the box size you can use the left mouse button with the cursor at any corner of the purple box to change it. Make sure the purple box is as close to the pocket as possible. |
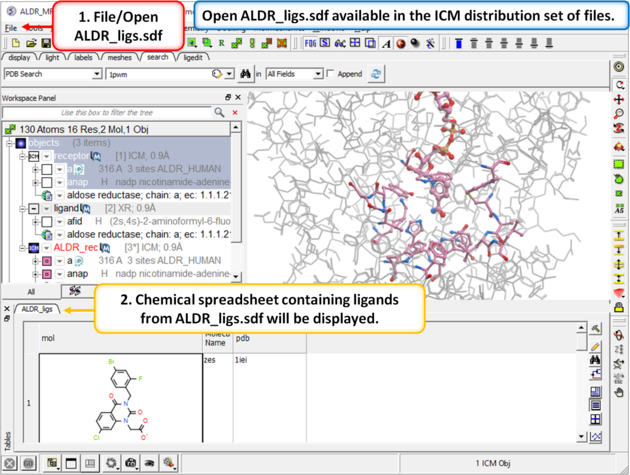 |
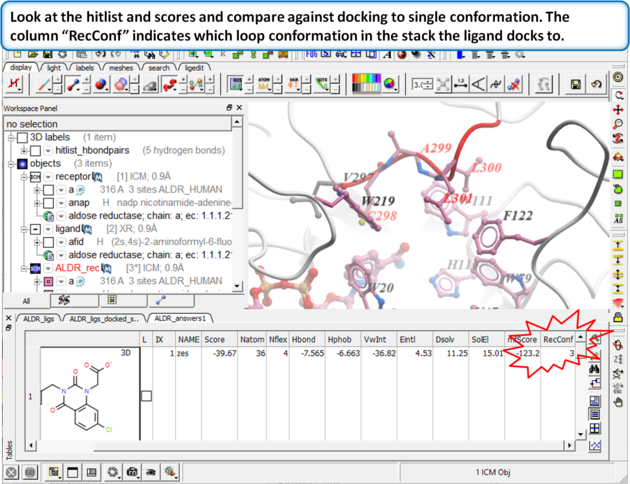
| Step 6: In the next part of this exercise we will try to determine if other inhibitors to this receptor could be correctly docked using this one crystal structure or if more than one representation of the receptor is needed. We have already setup the docking project and made all the required maps (Steps 1 to 3) so now let us dock a set of inhibitors to the receptor. We will dock a database called ALDR_ligs.sdf which should be present in your ICM distribution if you cannot find this example sdf file then please E mail support@molsoft.com and we will E mail it to you. |
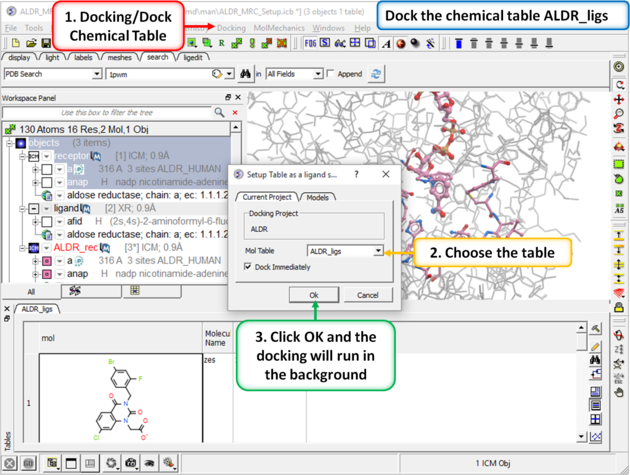 |
| Step 7: Dock the chemical table. |
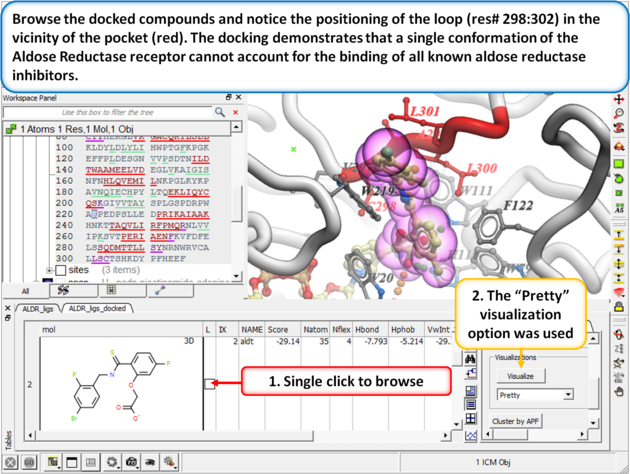 |
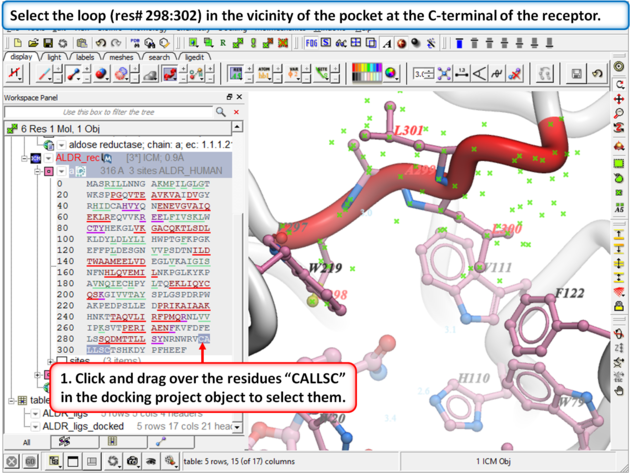
| Step 8:
Browse the docked compounds and notice the positioning of the loop (res# 298:302) in the vicinity of the pocket (red). The docking demonstrates that a single conformation of the Aldose Reductase receptor cannot account for the binding of all known aldose reductase inhibitors.
|
 |
| Step 9: |
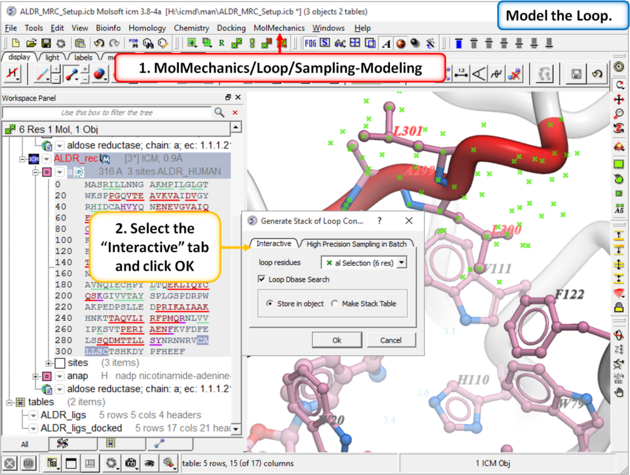 |
| Step 10: Model the loop using MolMechanics/Loop/Sampling-Modeling |
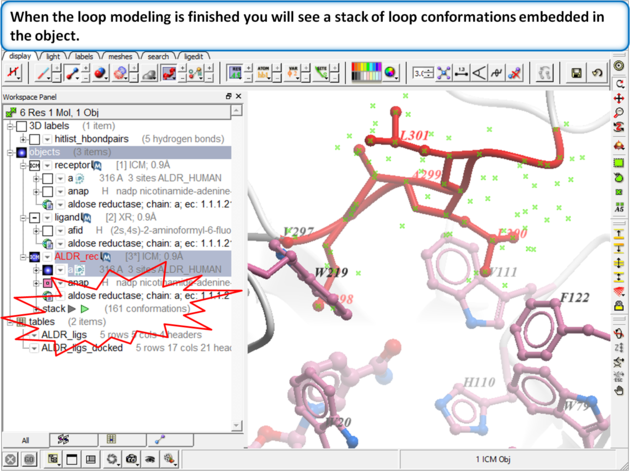 |
Step 11:
|
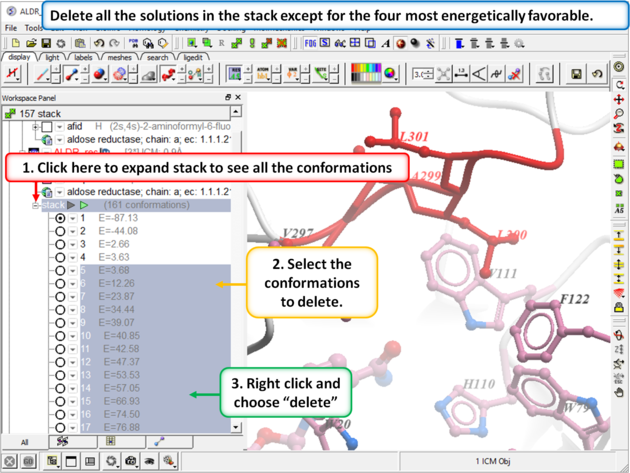 |
Step 12:
|
|
| Step 13: Build the maps for each loop conformation using Choose the menu option Docking/Flexible Receptor/Setup 4D Grid. |
|
| Step 14: Dock the ALDR_ligs table again to the multiple receptors using Docking/Dock Chemical Table. |
 |
| Step 15: |
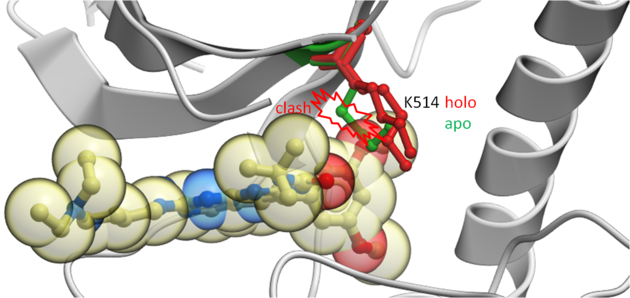
This example demonstrates how to keep certain residues as explicit during grid docking. Full side-chains or hydroxyls and water can be treated as flexible. In this example we look at some crystal structures of the tyrosine kinase domain of Fibroblast Growth Factor where we observe that inhibitors cannot be docked into the apo-form without a Lysine (K514) residue in the pocket being treated as flexible.
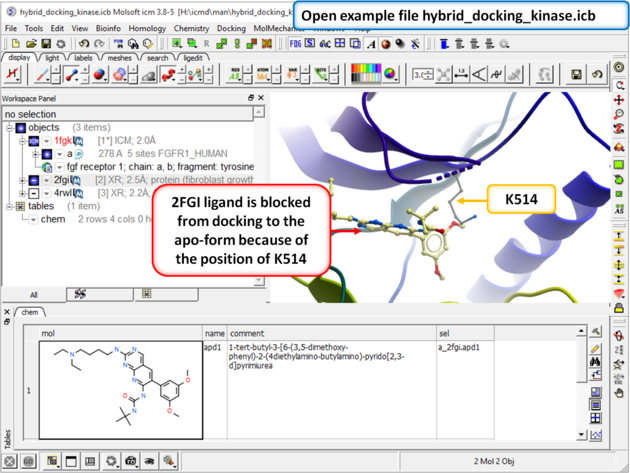 |
| Step 1: Download and open the prepared ICM file. The file can be downloaded here https://molsoft.com/addons/ftp/workshop (1. cut and paste the address into a web browser. 2. Right click on hybrid_docking_kinase.icb and choose "Save Link As". 3. Open the .icb in ICM File/Open). Notice that the inhibitor from PDB 2fgi cannot dock to the apo structure (PDB 1fgk) because of the position of K514). |
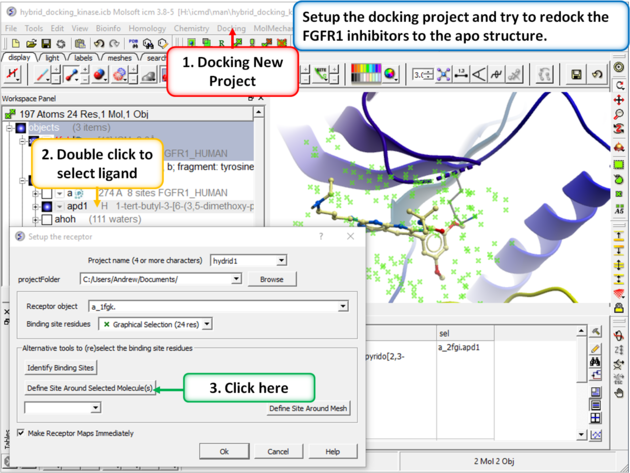 |
| Step 2: Setup the docking project using the ligand from PDB 2fgi to define the docking site. |
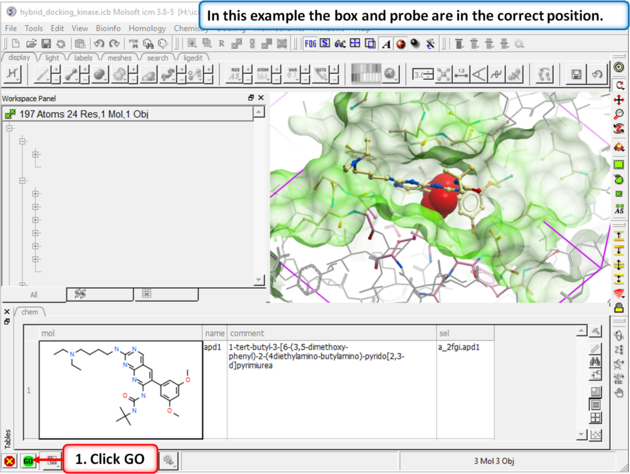 |
| Step 3: In this example you do not need to change the position of the probe or size of the box. Press GO. |
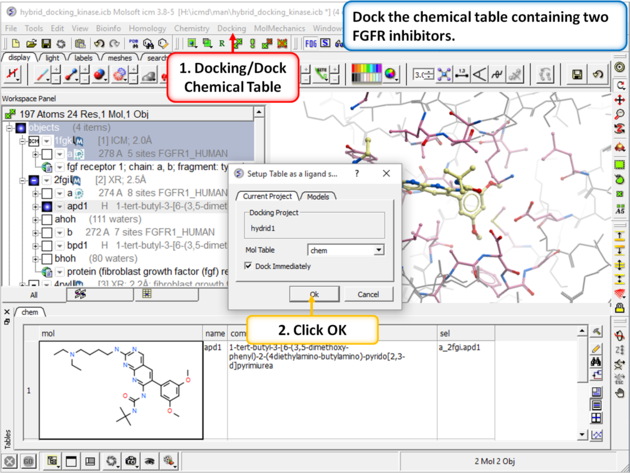 |
| Step 4: Dock the chemical table called "chem". This table contains two FGFR1 inhibitors from PDB 4RWL and 2FGI. |
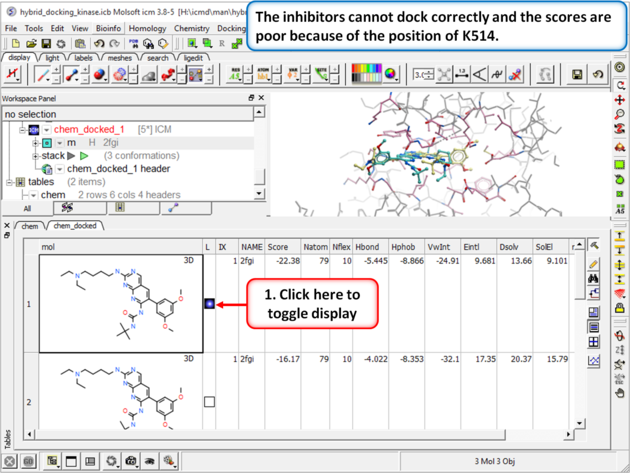 |
| Step 5: Browse the hitlist and you will see that the inhibitors cannot dock correctly and the scores are poor because of the position of K514.
|
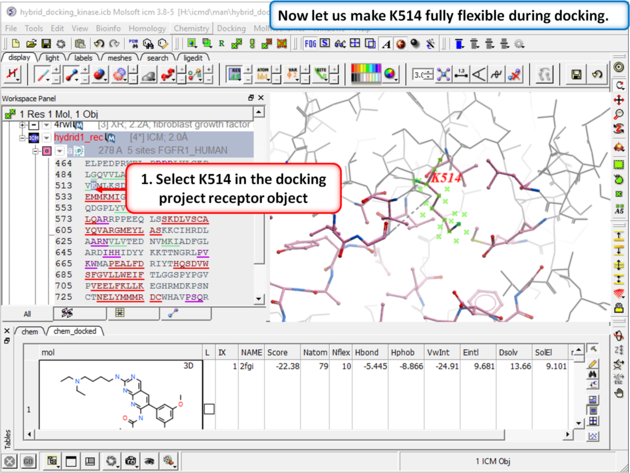 |
| Step 6: Select K514 in the docking project receptor object. |
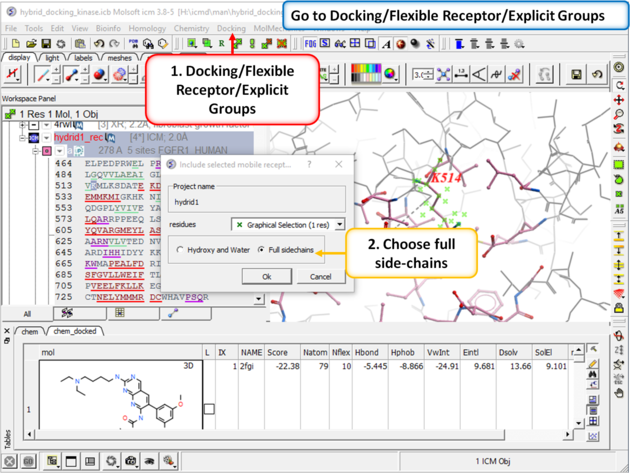 |
| Step 7: Go to Docking/Flexible Receptor/Explicit Groups and choose Full Side-Chain. |
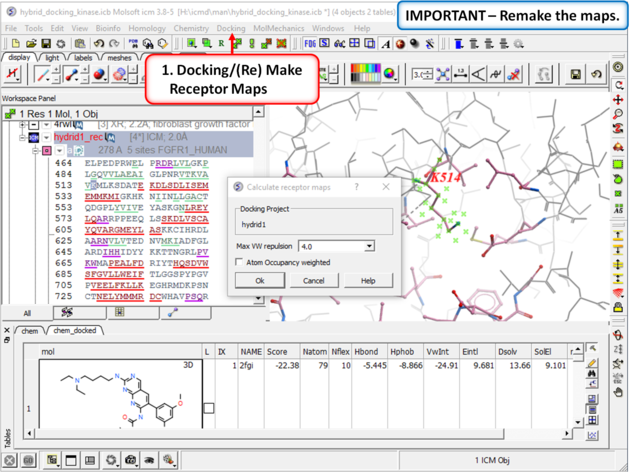 |
| Step 8: Remake the receptor maps (Docking/(Re) Make Receptor Maps). |
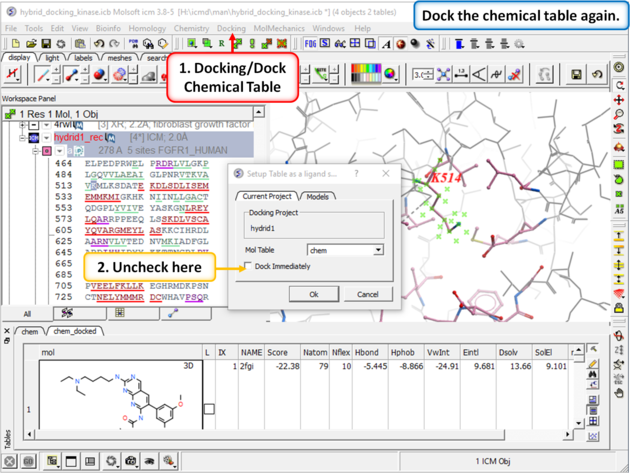 |
| Step 9: Dock the chemical table (chem) again but this time uncheck the box "Dock Immediately". |
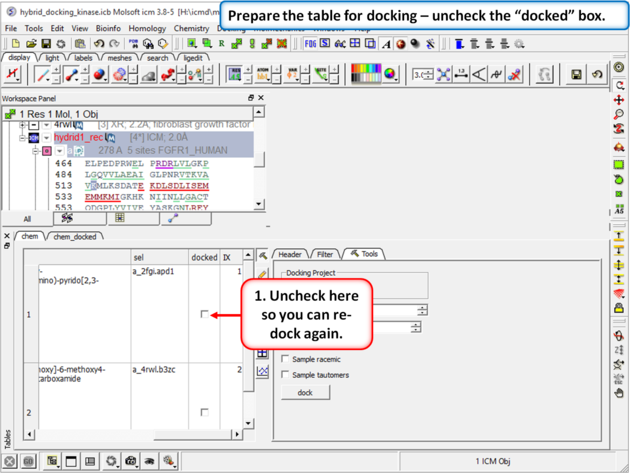 |
| Step 10: Prepare the table for docking by removing the check from the "docked" box in the chem table. |
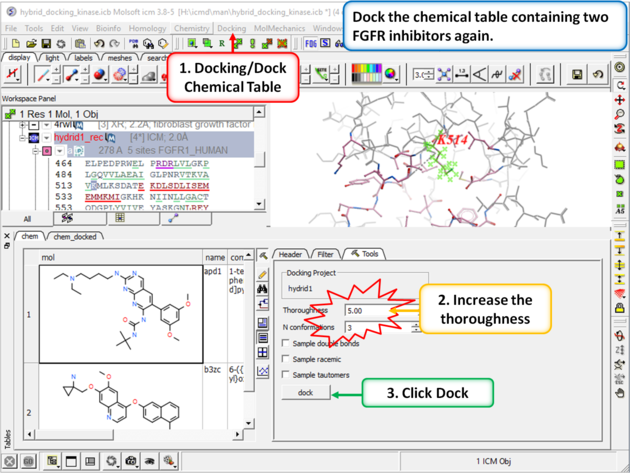 |
| Step 11: Change the thoroughness (effort) to 5 or more and click dock. This option increases the length of the simulation to account for the flexible residue. |
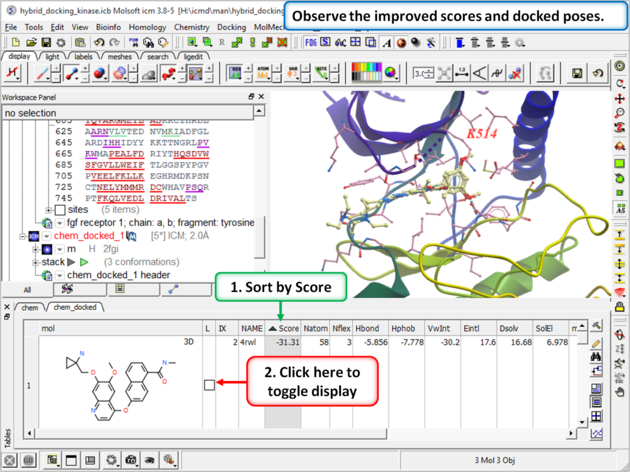 |
| Step 12: Once the docking has finished observe the improved scores and poses and see that the Lysine residue has moved to accommodate the ligand. |