Google Search the Manual:
Keyword Search:
| Prev | ICM User's Guide 22.1 Working with the Graphical User Interface | Next |
Getting to know the ICM Graphical User Interface: KRAS-Sotorasib Structural Analysis Example
Reference Video: Exploring the ICM Graphical User Interface
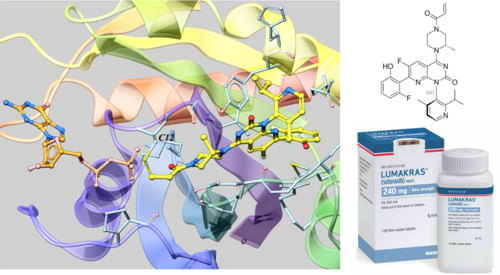
Visualizing Covalent Inhibition: A KRAS G12C Case Study
KRAS functions as a molecular switch, cycling between active (GTP-bound) and inactive (GDP-bound) states to regulate cell signaling. In Non-Small Cell Lung Cancer (NSCLC), the G12C mutation impairs GTP hydrolysis, trapping the protein in a constitutive "on" state that drives oncogenesis. Sotorasib (AMG 510) targets this by binding to a cryptic allosteric pocket beneath the Switch II loop (residues 58-72) specifically during the inactive GDP-bound conformation. Once bound, Sotorasib forms a permanent covalent bond with the mutant Cys12 residue, locking KRAS in the "off" position and effectively silencing the signaling pathway.
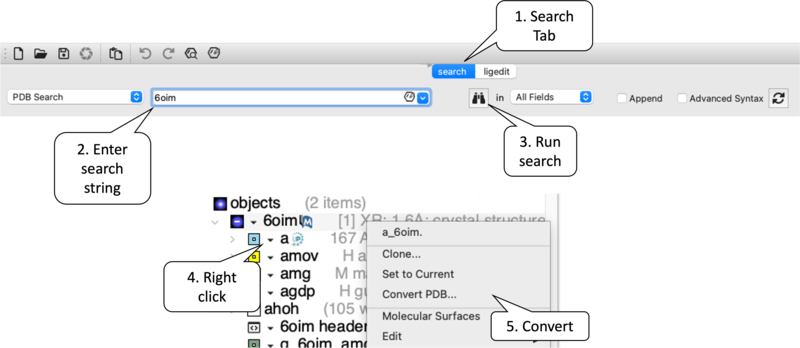
Task 1: Read in a PDB file and Convert to an ICM Object
Objective: Import the PDB structure and convert to an ICM object.
- [00:10] Search PDB: Navigate to the Search Tab → Enter 6OIM → Execute search via the Binoculars icon.
- [02:39] Convert to ICM: Right-click the
6OIMobject in the Workspace → Select Convert PDB.- Configuration: Enable Replace Original and Keep Tight Waters. Confirm with OK.
- Verification: The object prefix in the ICM workspace should now update to ICM.
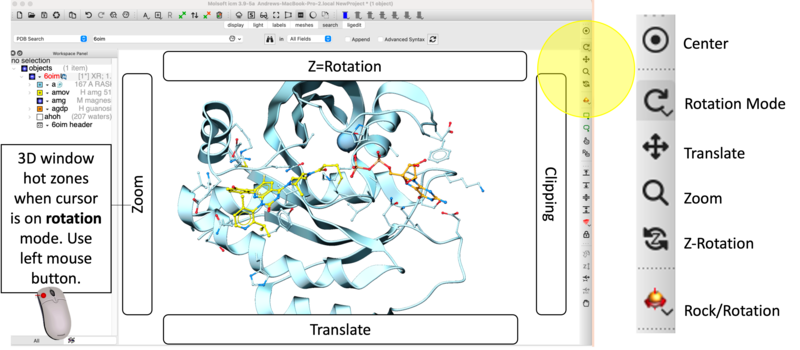
Task 2: Workspace Navigation & Visualization Tools
Objective: Isolate the binding site, optimize the visual representation and make slides.
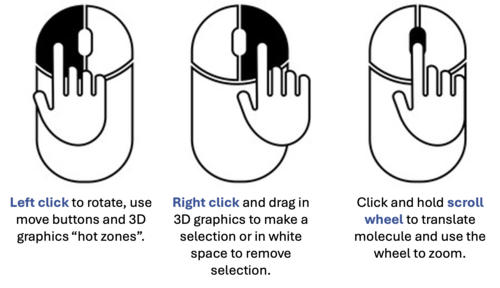
- [03:28] Navigation Controls: Utilize the Rotate Mode and graphics window hotspots for precise zooming, rotation and molecule manipulation.
- [04:44] Center on Ligand: Double-click the ligand identifier (e.g.,
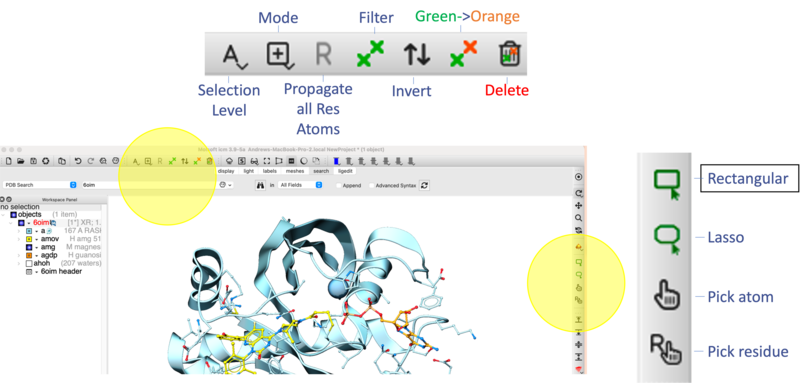
amov) in the Workspace tree and click on the center button. - [01:57] Residue Identification: Use the Pick Residue Selection button to highlight Cys12 at the covalent attachment site. A text residue label is automatically applied using this option - you can modify font color and size by clicking and holding on the Residue label button in the Display tab.
- [05:21] Change Color of Ligand Carbon Atoms: Select the ligand in the ICM workspace (double click) and then click and hold the Stick button in the Display Tab → Choose Color C → Select Green. This preserves standard CPK colors for heteroatoms.
- [05:44] (Un)Display Molecules using the ICM Workspace: Toggle the Undisplay buttons to hide GDP and Waters, focusing the view on the primary pocket.
- [06:09] Save Slides: Click the Camera Icon at the footer of the graphics window to save the current orientation as a Slide. Read more here...
Task 3: Molecular Interaction Mapping
Objective: Identify the covalent linkage and key non-covalent anchors.
- [05:00] Interaction Analysis: Right-click the ligand → Display Pocket → Ligand Pocket Interactions.
- [06:34] Display Tuning: Use the +/- buttons in the Display Tab to adjust the thickness of interaction dashes for better visibility.
- [09:22] 2D Topology: Right-click ligand → Advanced → Tools → Ligand 2D Diagram to generate a flat map of interactions.
Task 4: Structural Dynamics & Surface Modeling
Objective: Characterize mobile loops and electrostatic pocket properties.
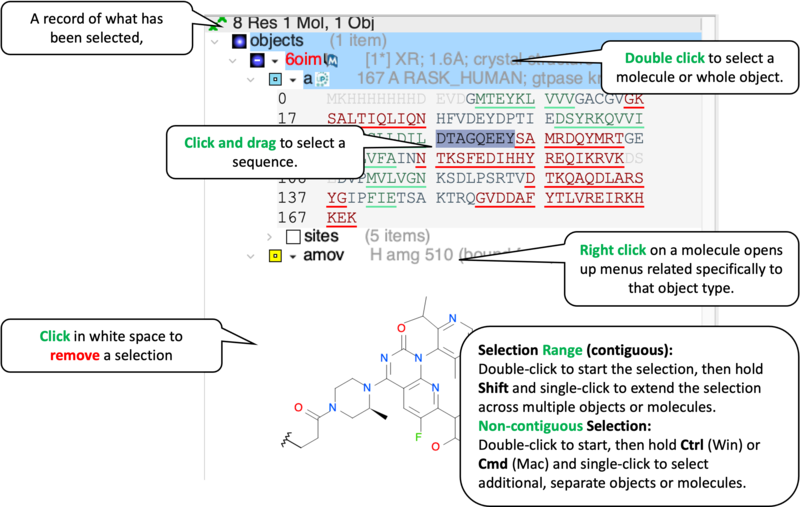
- [07:22] Switch II Loop Selection: In the sequence viewer, click-drag to select residues 58 through 65.
- [07:50] Highlighting Regions: Apply a Magenta Ribbon to the selection to differentiate the mobile loop from the protein core.
- [08:25] Pocket Property Mesh: Right-click ligand → Display Pocket → Receptor Pocket Mesh.
- Legend: Blue (Donor), Red (Acceptor), Green (Hydrophobic).
Task 5: Comparative Superposition
Objective: Evaluate conformational changes between bound and apo states.
- [10:19] Load Reference: Fetch PDB 4OBE (Closed state).
- [11:08] Structural Alignment:
- Select Chain A for both
6OIMand4OBEin the Workspace (Ctrl/Cmd + Click). - Navigate to Display Tab → Superimpose.
- Select Chain A for both
- [11:54] Differential Analysis: Observe the shift in the Switch II loop (Magenta) required to accommodate the inhibitor.
Troubleshooting & Tips
- [04:13] Clipping Adjustment: If the molecular object appears truncated, use the Unclip button or the right-side vertical bar to adjust clipping planes.
- [06:02] Selection Clearance: Clear active green crosses by clicking the Eraser icon in the toolbar or right-clicking in the white space of the graphics window.
| Prev Workshop Examples | Home Up | Next Drug Target Analysis and Preparation |