[ Ligand Pocket Interactions | Pocket Surface | Ligand Surface | Hydrogen Bonds | PiPi ]
| Available in the following product(s): ICM-Browser | ICM-Browser-Pro | ICM-Pro |
To view and center on the ligand pocket interactions.
- Right click on the ligand in the ICM Workspace and navigate to Display Pocket -> Ligand Pocket Interactions. The system will automatically display hydrogen bonds, key water molecules, and neighboring residues centered on the view.
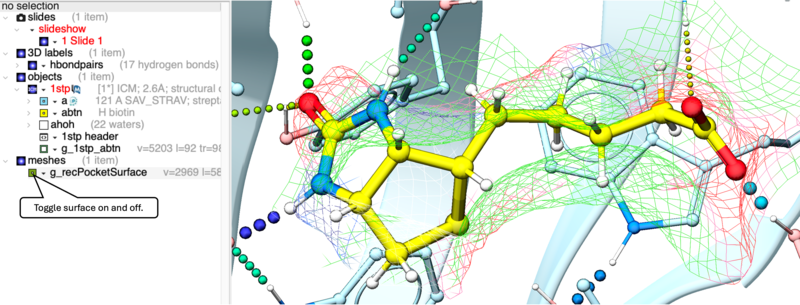
To display the Receptor Pocket Surface:
- As an example we will use the PDB structure 1STP. Type 1STP in the pdb search tab and press return.
- Convert the protein to an ICM object. If you do not convert a generic surface will be displayed that is not colored by binding property.
- Right click on the ligand "abtn" and select Display Pocket -> Receptor Pocket Mesh.
- Select whether you would like to display side-chain hydrogen bonds and label.
- The receptor pocket will be displayed and colored by binding property - White=aromatic lipophilic, Green=non-aromatic other (mostly aliphatic) lipophilic surface, Red=hydrogen bonding acceptor potential, Blue=hydrogen bond donor potential.
- The surface can be toggled on and off by selecting in the ICM Workspace in the meshes section.
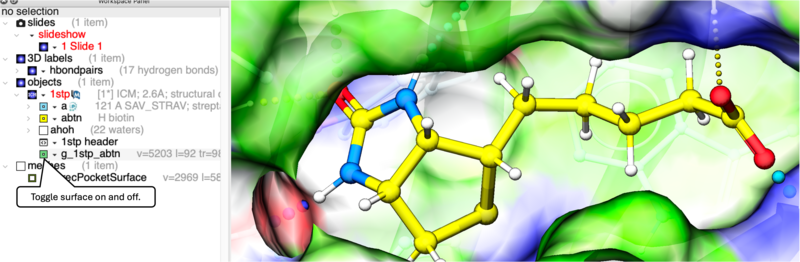
The Ligand Surface option allows you to visualize cavities that are open for ligand modifications. The ligand surface is colored with the opposite (complementary) property to the receptor surface. This allows you to easily identify modification types: matching colors between the ligand and receptor immediately highlights areas where the ligand's chemical properties perfectly complement the binding pocket.To display the Ligand Surface:
- As an example we will use the PDB structure 1STP. Type 1STP in the pdb search tab and press return.
- Convert the protein to an ICM object. If you do not convert a generic surface will be displayed that is not colored by binding property.
- Right click on the ligand "abtn" and select Display Pocket -> Ligand Surface.
- The Ligand Surface will be displayed colored by property - White=aromatic lipophilic, Green=non-aromatic other (mostly aliphatic) lipophilic surface, Red=hydrogen bonding acceptor potential, Blue=hydrogen bond donor potential.
[ Edit Hydrogen Bond Label | Move Hydrogen Bond Label ]
| NOTE: The method by which hydrogen bonds are calculated is described here in the command line manual. The GRAPHICS.hbondMinStrength parameter determines the hbond strength threshold for hbond display. The strength value is between 0. and 2. By changing 1. to 0.2 you will see more weak hydrogen bonds. |
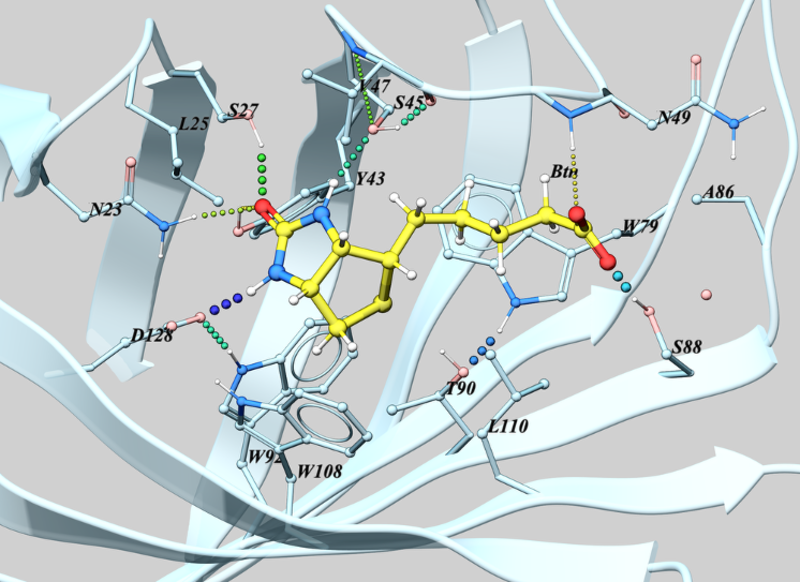
- In order to display energy related properties we need to convert the PDB file into an ICM object. Convert 1STP into an ICM object. In this example, the option "Replace the Original" was selected.
- Display the receptor in wire format and the ligand in xstick.
- Right click on the ligand and select "Neighbors" - Enter 3 Angstroms and Type = Visible. Do not exclude source (the ligand) therefore remove tick from box entitled "exclude source".
- Select the display tab and then select the Display H-Bond button.
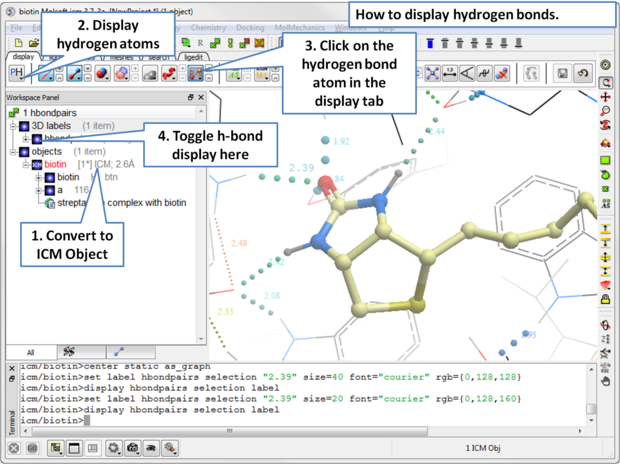
| NOTE: Different options for displaying the H-bond can be accessed by clicking and holding on the H-bond button in the "Display" tab. The coloring of the H-bonds are red (strong hydrogen bonds - thick spheres) to blue (weak hydrogen bonds - thin spheres). Once the hydrogen bonds have been displayed they can be displayed and undisplayed in the 3D labels section of the ICM Workspace (left hand side of graphical window). |
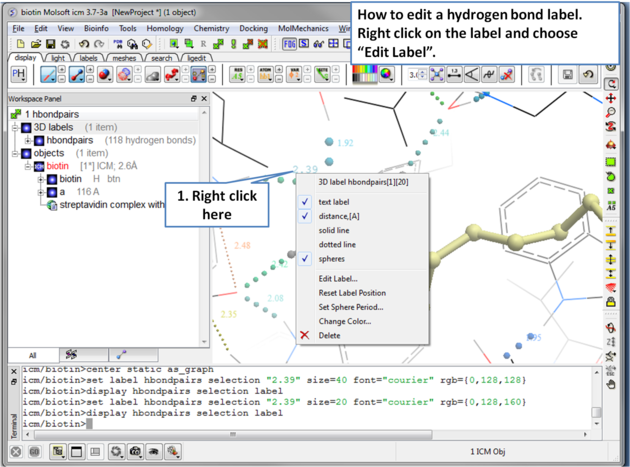
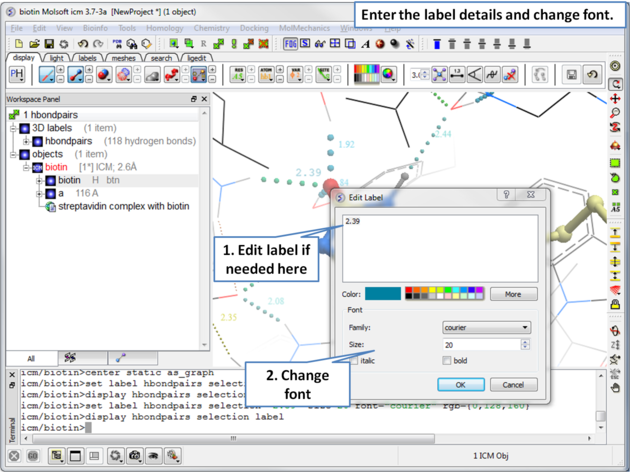
To edit a hydrogen bond label
- Right click on the label.
- Choose Edit Label.
- Make changes in the dialog box and press OK.
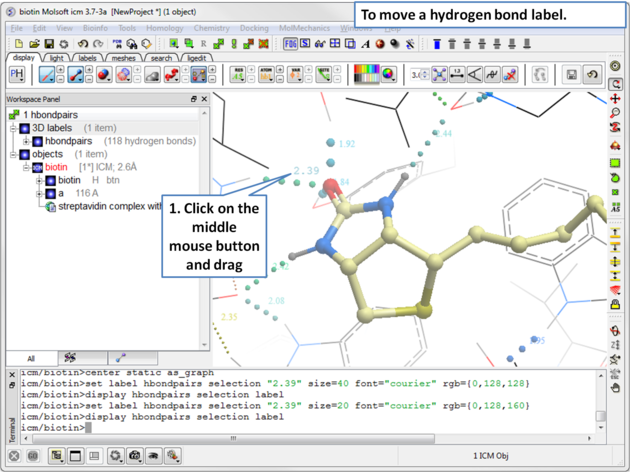
To move a hydrogen bond label
- Right click on the label.
- Click on the label using the middle mouse button.
- Hold the middle mouse button down and drag.
- Read in the molecule of interest.
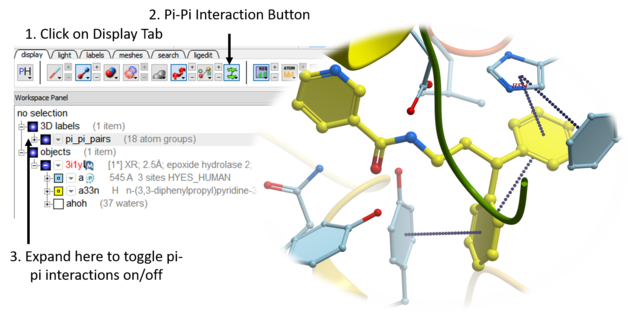
- Click on the Pi-Pi interactions button in the dispay tab. See image below.
- All pi-pi interactions will be shown in the display as dotted lines and listed in the ICM workspace.
- You can change the pi-pi maximum distance parameter by clicking and holding on the pi-pi interaction button.
- To display the distance of the pi-pi or pi-cation - open the 3D labels panel in the ICM workspace and locate the interaction. Right click on the blue box which controls the display and choose 'number'.