[ Related Chains | Calculate RMSD | Contact Areas | Closed Cavities | Surface Area | Distances | Planar Angle | Dihedral Angle | Ramachandran Plot | Ramachandran Export ]
| Available in the following product(s): ICM-Browser-Pro | ICM-Pro |
In this chapter we describe the tools available for analyzing protein structure. These tools include calculating RMSD, identifying closed cavities, calculating contact and surface area, measuring anlgles and distances, and generating Ramachandran plots.
Chapter Contents:
- Find Related Chains
- Calculate RMSD
- Contact Areas
- Identify Closed Cavities
- Surface Area
- Measure Distances
- Planar Angle
- Dihedral Angle
- Ramachandran Plot Interactive
- Export Ramachandran Plot
This option allows you to search the currently loaded PDB files or ICM objects and identify chains which are similar and/or related.
You can do this by:
- Select the objects or pdb files you want to compare.
- Tools/Analysis/Find Related Chains
- Click OK to confirm the selection you made
- A table as shown below will be displayed.
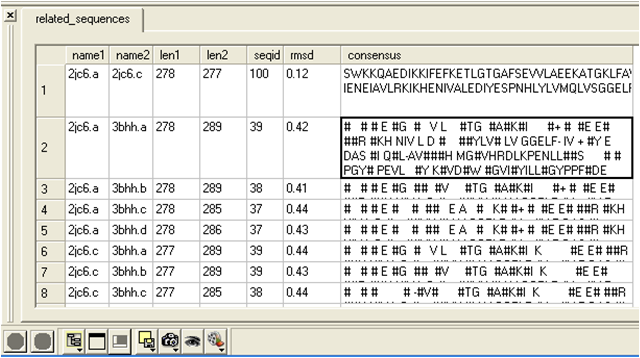
name1 = Name of query structure molecule name2 = Name of hit len1 = length of query len2 = length of hit seqid = Sequence identity percentage consensus = Consensus sequence
| NOTE: This option is for protein structures only not for chemical compounds. You can use the command line options RMSD (http://molsoft.com/man/icm-functions.html#Rmsd) and Srmsd (http://molsoft.com/man/icm-functions.html#Srmsd) for chemicals. |
To calculate RMSD between two protein structure:
- Read into ICM the two structures ( File/Open or PDB Search or Read in Chemical) you wish to compare.
- Select one of the two molecules you wish to compare, you can do this by double clicking on the name of the structure in the ICM Workspace. Convert this selection to an Orange Selection.
- Select the second molecule, and then you should have one orange and one green selection in the graphics display.
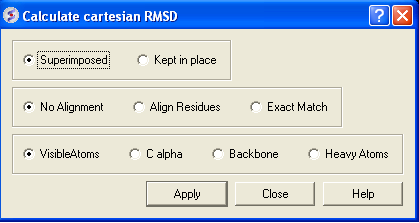
- Select whether you wish the atoms to be superimposed onto one another or kept in place. The kept in place option would be ideal for comparing docked structures.
- Choose whether you wish to make the superposition by alignment or exactly matching the atom names.
- Select which atom types you wish to superimpose.
The RMSD value will be displayed in the terminal window.
- Read in a protein structure ( File/Open or PDB Search).
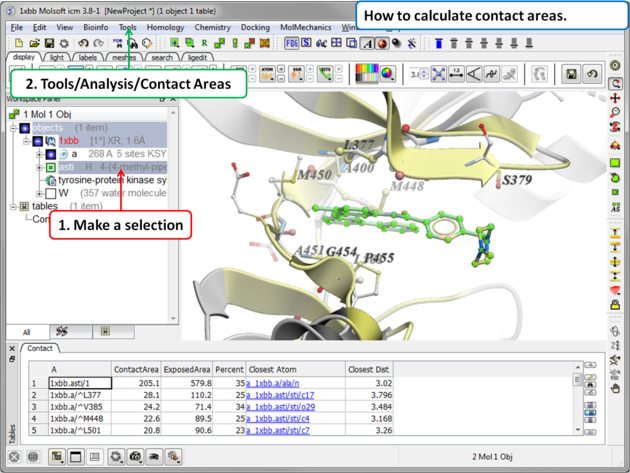
- Select the region you wish to analyse.
- Tools/Analysis/Contact Areas
- The xstick display in the region will be scaled according to the atom/residue contact area. For example, residues making large contacts with a ligand will be displayed in thicker xstick representation (and colored yellow) than those making less significant contacts.
- A table as shown below will be displayed.The table lists the contact area, exposed area, percentage of contact area compared to exposed, the nearest atom of a residue and the distance.
This tool will identify cavities within a molecule which are completely closed,. If you are looking for buried and open pockets then use icmPocketFinder.
- Read in a protein structure ( File/Open or PDB Search).
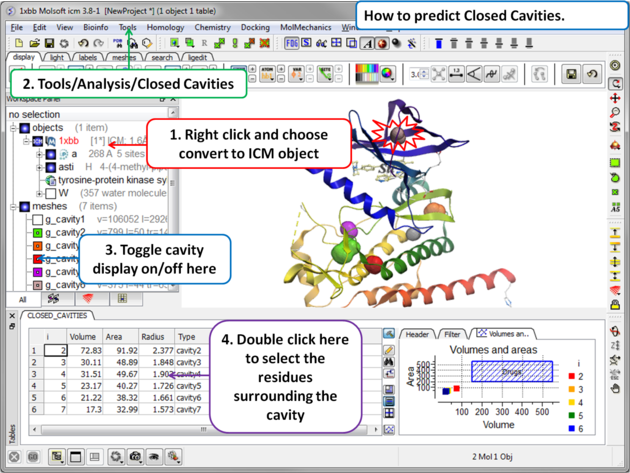
- Convert the protein structure to an ICM object.
- Tools/Analysis/Closed Cavities
- Use the drop down arrow to locate the molecule you are interested in.
- Enter the minimum volume of the cavities you wish to identify.
- Click OK
- The closed cavities will be displayed in the meshes section of the ICM Workspace and a table of the cavities will be displayed. Double click on a row in the table to jump to a particular closed cavity and select the residues surrounding it.
| What is the difference between Closed Cavity and ICMPocketFinder? Closed pocket (cavityFinder) is purely geometrical/topological - it is a part of molecular surface that is completely disconnected from the exterior surface. It means that a probe sphere of 1.4A radius (representing a water molecule) can not pass in or out of the cavity (considering protein as completely rigid of course). icmPocketFinder identifies pockets that are likely to contain ligands (not specifically open or closed pockets). Pockets are defined based on physical interaction rather than geometric criterion. Blobs of 'pocket density' generated by icmPocketFinder represent continuous regions of space where there is significant favorable van der Waals interaction with the receptor. |
This option calculates solvent accessible area of each selection in multiple objects and stores it in a table. If a molecule is specified in a multi-molecular object, the surface area of an isolated molecule is calculated and other molecules are ignored. The area is reported in square Anstroms and the probe radius is assumed to be the value set in the variable waterRadius.
Output: the macro creates table AREA . The empty comment field is added for user's future use. If the table exists, new rows are appended.
To calculate a surface area:
- Read in a protein structure ( File/Open or PDB Search).
- Select the region you wish to analyse.
- Tools/Analysis/Surface Area
- A table will be displayed listing the residues in the selection along with the corresponding total surface area.
There are two approaches to calculating and displaying distances between atoms. You can either use the options in the Labels tab or use Tools/Analysis/Distance.
To display all to all distances:
- Select the atoms between which you would like to find the distance. (See selection toolbar)
- Tools/Analysis/Distance
- Select all to all
To display intermolecular distances
- Select the atoms between which you would like to find the distance. (See selection toolbar)
- Tools/Analysis/Distance
- Select intermolecular
To display the distances between the same atoms in two objects.
- Select the atoms between which you would like to find the distance. (See selection toolbar)
- Tools/Analysis/Distance
- Select same atoms in two objects
| NOTE: Distances can be displayed and undisplayed in the 3D labels section of the ICM Workspace. You can change the color of a distance label by right clicking on it in the ICM Workspace. You can also export the distance to a table. |
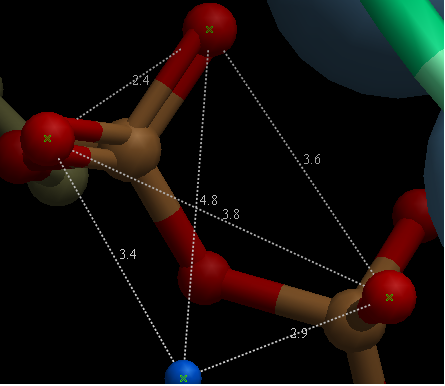
If you wish to find the planar angle between three atoms:
- Select Tools/Analysis/PlanarAngle
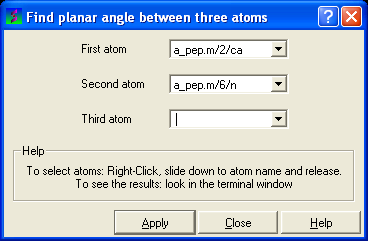
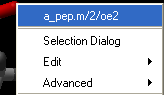
- Right click on the each of the three atoms which you wish to use, and select their name. The spaces next to First atom, Second atom, and Third atom should now contain the name of your atoms.
- Click Apply to display the angle measure in the terminal window.
![]()
In order to find the angle dihedral angle between two sets of atoms:
- Select Tools/Analysis/Dihedral Angles.
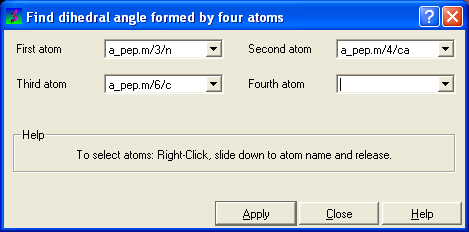
- Right click on each of the four atoms which you wish to use, and select the name of the atoms. The spaces next to Atom 1, Atom 2, Atom 3, and Atom 4 should now contain the names of your atoms.
- To find the correct angle, select your atoms according to the following diagram:
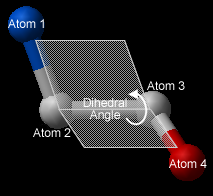
- Click Apply to display your dihedral angle measure in the terminal window.
To make an interactive ramachandran plot:
- Read in a protein structure ( File/Open or PDB Search).
- Select the structure you wish to build the plot for. You can do this by double clicking on the name of the structure in the ICM Workspace (a selection is highlighted blue in the ICM Workspace and green crosses in the graphical display) or you can use the right-click button and drag it over the whole structure in the graphical display.
- Tools/Analysis/Ramachandran Plot Interactive
- The interactive ramachandran plot will be displayed in table called RAMA.
- You can view the Omega, Phi/Psi (Gly) or Phi/Psi angles by clicking on the tabs at the top of the plot. Each point is linked to the data in the table RAMA and also to the graphical display. Clicking on a point in the plot will highlight the corresponding angles in the table and also center on this region in the 3D display.
- Read in a protein structure ( File/Open or PDB Search).
- Select the structure you wish to build the plot for. You can do this by double clicking on the name of the structure in the ICM Workspace (a selection is highlighted blue in the ICM Workspace and green crosses in the graphical display) or you can use the right-click button anddrag it over the whole structure in the graphical display.
- Tools/Analysis/Ramachandran Plot Export
A postscript viewer needs to be downloaded onto your machine in order to view the plot. This can be downloaded from http://www.cs.wisc.edu/~ghost/. Once this software is downloaded you need to tell ICM where it is located by typing the pathname into File/Preferences.
| NOTE: You can always export the plot as an image directly in ICM without exporting. You can do this by right clicking on the plot and select save as image. Another approach could be to export the RAMA table to Excel and use the plotting tools there. You can do this by right clicking on the table name tab and selecting "Export to Excel" or save as ".csv". |