[ Display Tab | Light Tab | Labels Tab | PDB Search Tab | Ligedit Tab | Meshes Tab ]
In this section we describe the contents of the tabs in the graphical user interface.
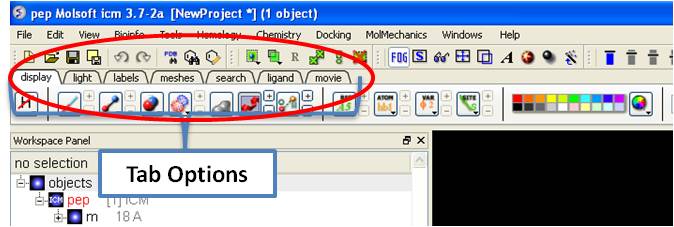
The display tab contains tools for a variety of functions including - structural representations, coloring, labeling and superposition. This tab is shown below.
![]()
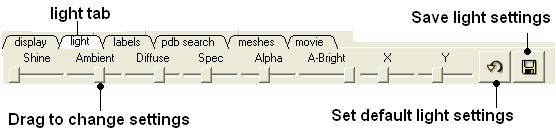
The options in this tab are described in the Lighting Section.
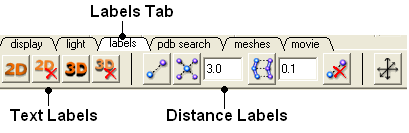
The options in this tab are described in the labels section of this manual.
Instructions on how to use this tab can be found in the Search PDB section.
Instructions on how to use the options in this tab can be found in the How to use the 3D Interactive Ligand Editor section.
Click on the tab button entitled 'meshes' and three different graphical display tools are available for you to use. The three displays are surface, meshes and macroshape and are collectively referred to as meshes.
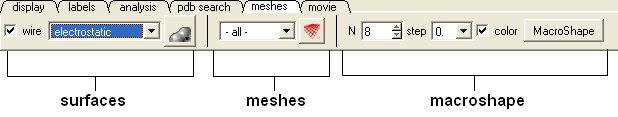
The benefits and applications of each display are described in the section.